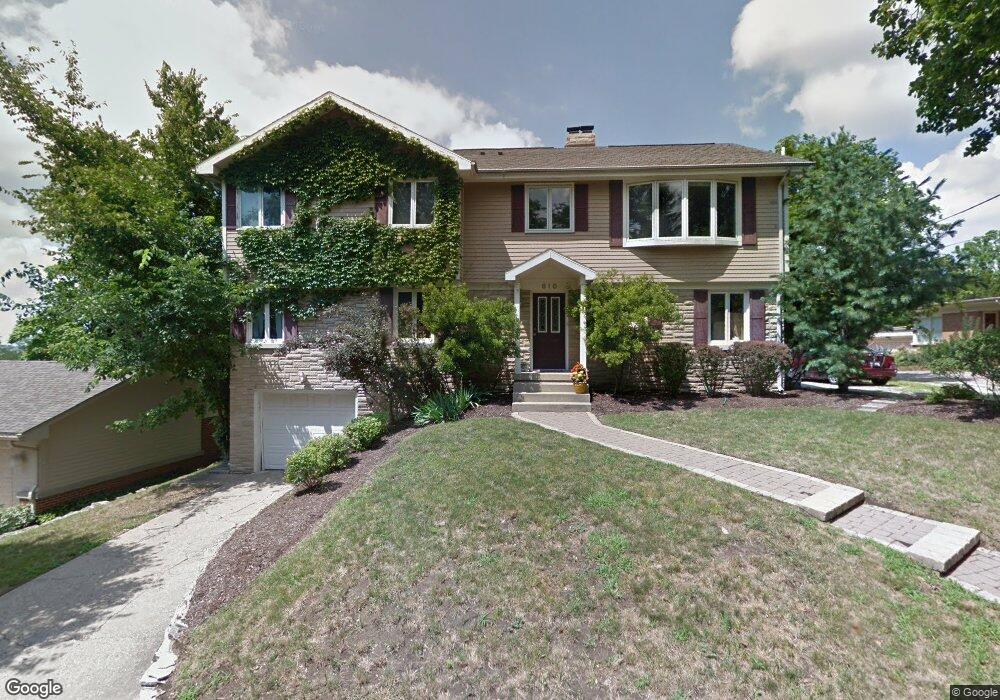
610 Lingle Terrace Lafayette, IN 47901
Ellsworth Romig NeighborhoodEstimated Value: $396,000 - $533,000
--
Bed
1
Bath
2,976
Sq Ft
$146/Sq Ft
Est. Value
About This Home
This home is located at 610 Lingle Terrace, Lafayette, IN 47901 and is currently estimated at $435,748, approximately $146 per square foot. 610 Lingle Terrace is a home located in Tippecanoe County with nearby schools including Thomas Miller Elementary School, Sunnyside Intermediate School, and Lafayette Tecumseh Junior High School.
Ownership History
Date
Name
Owned For
Owner Type
Purchase Details
Closed on
May 31, 2023
Sold by
Bernstein Mark
Bought by
Bernstein Mark H and Holden Stacy E
Current Estimated Value
Home Financials for this Owner
Home Financials are based on the most recent Mortgage that was taken out on this home.
Original Mortgage
$320,000
Outstanding Balance
$311,506
Interest Rate
6.43%
Mortgage Type
Credit Line Revolving
Estimated Equity
$124,243
Purchase Details
Closed on
Jul 14, 2005
Sold by
Rubin Douglas L and Rubin Laura L
Bought by
Bernstein Mark and Mcmillan Rebecca
Home Financials for this Owner
Home Financials are based on the most recent Mortgage that was taken out on this home.
Original Mortgage
$250,400
Interest Rate
5.69%
Mortgage Type
Fannie Mae Freddie Mac
Create a Home Valuation Report for This Property
The Home Valuation Report is an in-depth analysis detailing your home's value as well as a comparison with similar homes in the area
Home Values in the Area
Average Home Value in this Area
Purchase History
| Date | Buyer | Sale Price | Title Company |
|---|---|---|---|
| Bernstein Mark H | -- | None Listed On Document | |
| Bernstein Mark | -- | -- |
Source: Public Records
Mortgage History
| Date | Status | Borrower | Loan Amount |
|---|---|---|---|
| Open | Bernstein Mark H | $320,000 | |
| Previous Owner | Bernstein Mark | $250,400 |
Source: Public Records
Tax History Compared to Growth
Tax History
| Year | Tax Paid | Tax Assessment Tax Assessment Total Assessment is a certain percentage of the fair market value that is determined by local assessors to be the total taxable value of land and additions on the property. | Land | Improvement |
|---|---|---|---|---|
| 2024 | $6,619 | $325,200 | $30,000 | $295,200 |
| 2023 | $3,061 | $306,100 | $30,000 | $276,100 |
| 2022 | $2,698 | $269,800 | $30,000 | $239,800 |
| 2021 | $2,539 | $253,900 | $30,000 | $223,900 |
| 2020 | $2,301 | $230,100 | $30,000 | $200,100 |
| 2019 | $2,542 | $254,200 | $52,500 | $201,700 |
| 2018 | $2,542 | $254,200 | $52,500 | $201,700 |
| 2017 | $2,515 | $251,500 | $52,500 | $199,000 |
| 2016 | $2,468 | $246,800 | $52,500 | $194,300 |
| 2014 | $2,416 | $241,600 | $52,500 | $189,100 |
| 2013 | $2,317 | $231,700 | $52,500 | $179,200 |
Source: Public Records
Map
Nearby Homes