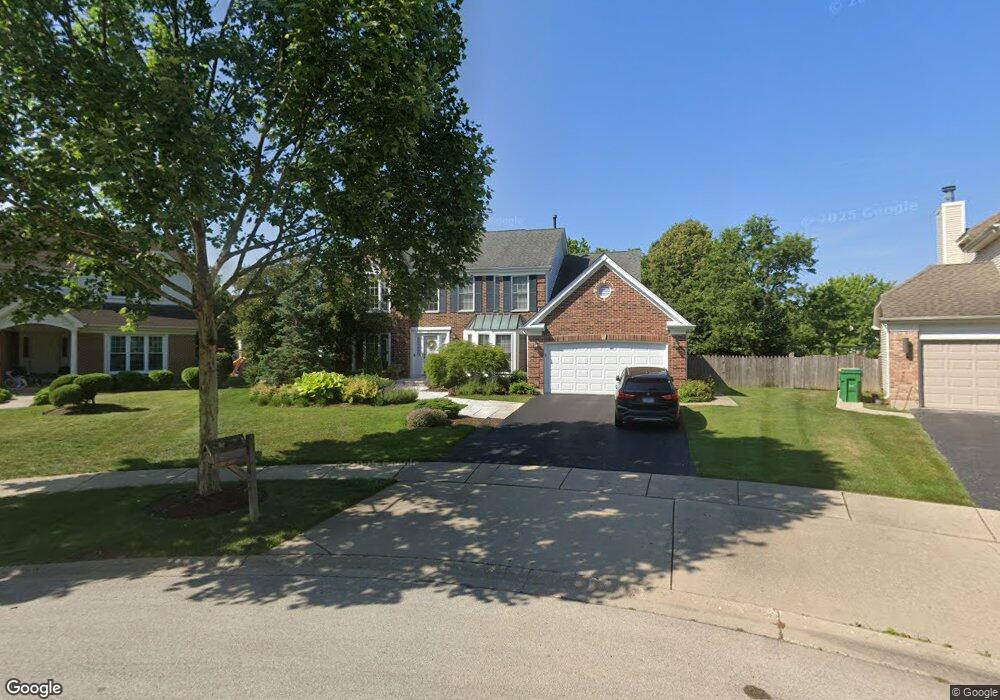
610 Mayfair Ct N Buffalo Grove, IL 60089
South Buffalo Grove NeighborhoodEstimated Value: $643,162 - $713,000
4
Beds
3
Baths
2,981
Sq Ft
$233/Sq Ft
Est. Value
About This Home
This home is located at 610 Mayfair Ct N, Buffalo Grove, IL 60089 and is currently estimated at $694,291, approximately $232 per square foot. 610 Mayfair Ct N is a home located in Cook County with nearby schools including Henry W Longfellow Elementary School, Cooper Middle School, and Buffalo Grove High School.
Ownership History
Date
Name
Owned For
Owner Type
Purchase Details
Closed on
Feb 24, 2001
Sold by
Lobocki David B and Bocek Denice C
Bought by
Lobocki David B and Bocek Denice C
Current Estimated Value
Purchase Details
Closed on
Jun 30, 2000
Sold by
Park Sun Duk
Bought by
Lobocki David B and Bocek Denice C
Home Financials for this Owner
Home Financials are based on the most recent Mortgage that was taken out on this home.
Original Mortgage
$304,800
Outstanding Balance
$104,191
Interest Rate
7.6%
Estimated Equity
$590,100
Purchase Details
Closed on
Sep 12, 1997
Sold by
Yun Keun H and Yun Kwang S
Bought by
Park Sun Duk
Home Financials for this Owner
Home Financials are based on the most recent Mortgage that was taken out on this home.
Original Mortgage
$187,500
Interest Rate
7.65%
Create a Home Valuation Report for This Property
The Home Valuation Report is an in-depth analysis detailing your home's value as well as a comparison with similar homes in the area
Home Values in the Area
Average Home Value in this Area
Purchase History
| Date | Buyer | Sale Price | Title Company |
|---|---|---|---|
| Lobocki David B | -- | -- | |
| Lobocki David B | $381,000 | -- | |
| Park Sun Duk | $208,333 | Attorneys Natl Title Network |
Source: Public Records
Mortgage History
| Date | Status | Borrower | Loan Amount |
|---|---|---|---|
| Open | Lobocki David B | $304,800 | |
| Previous Owner | Park Sun Duk | $187,500 | |
| Closed | Lobocki David B | $50,000 |
Source: Public Records
Tax History Compared to Growth
Tax History
| Year | Tax Paid | Tax Assessment Tax Assessment Total Assessment is a certain percentage of the fair market value that is determined by local assessors to be the total taxable value of land and additions on the property. | Land | Improvement |
|---|---|---|---|---|
| 2024 | $13,341 | $45,000 | $10,972 | $34,028 |
| 2023 | $12,803 | $45,000 | $10,972 | $34,028 |
| 2022 | $12,803 | $45,000 | $10,972 | $34,028 |
| 2021 | $13,608 | $41,847 | $7,771 | $34,076 |
| 2020 | $13,321 | $41,847 | $7,771 | $34,076 |
| 2019 | $13,351 | $46,549 | $7,771 | $38,778 |
| 2018 | $14,851 | $46,557 | $6,857 | $39,700 |
| 2017 | $14,597 | $46,557 | $6,857 | $39,700 |
| 2016 | $14,160 | $47,581 | $6,857 | $40,724 |
| 2015 | $13,116 | $41,231 | $5,942 | $35,289 |
| 2014 | $12,917 | $41,231 | $5,942 | $35,289 |
| 2013 | $11,922 | $41,231 | $5,942 | $35,289 |
Source: Public Records
Map
Nearby Homes
- 665 Thornwood Dr
- 455 Mayfair Ln
- 476 Raupp Blvd
- 250 Old Oak Dr Unit 275
- 234 Mohawk Trail
- 820 Weidner Rd Unit 409
- 535 Estate Dr
- 813 Stradford Cir Unit 21B2
- 310 Rosewood Ave
- 859 Beechwood Rd
- 410 Chatham Cir
- 561 Park View Terrace Unit 153
- 3300 N Carriageway Dr Unit 317
- 443 Diane Dr
- 10 Old Oak Dr Unit 103
- 3401 N Ellen Dr
- 51 Old Oak Dr Unit 414
- 51 Old Oak Dr Unit 302
- 408 Indian Hill Dr
- 921 Bernard Dr
- 620 Mayfair Ct N
- 600 Mayfair Ct N
- 635 Vernon Ct N
- 625 Vernon Ct N
- 605 Vernon Ln
- 630 Mayfair Ct N
- 595 Vernon Ln
- 640 Mayfair Ln
- 590 Mayfair Ct N
- 615 Vernon Ct N
- 645 Vernon Ct N
- 585 Vernon Ln
- 650 Mayfair Ln
- 580 Mayfair Ct N
- 570 Mayfair Ln
- 575 Vernon Ln
- 660 Mayfair Ln
- 655 Vernon Ct N
- 560 Mayfair Ln
- 565 Vernon Ln