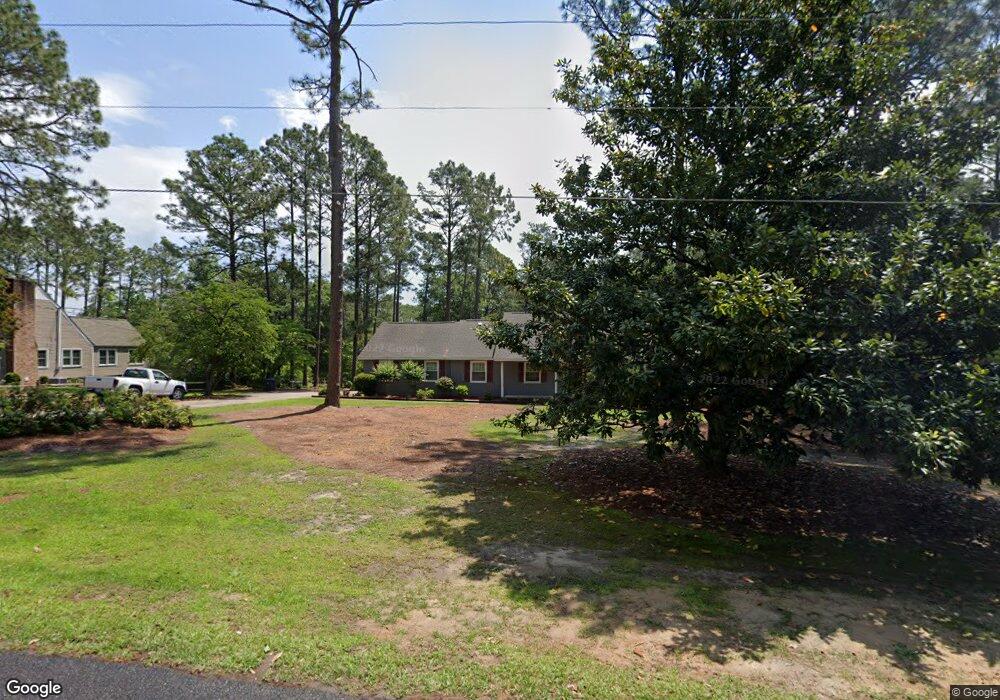
610 Mclean St Raeford, NC 28376
Estimated Value: $204,000 - $276,476
Studio
2
Baths
1,773
Sq Ft
$130/Sq Ft
Est. Value
About This Home
This home is located at 610 Mclean St, Raeford, NC 28376 and is currently estimated at $230,369, approximately $129 per square foot. 610 Mclean St is a home located in Hoke County with nearby schools including J.W. McLauchlin Elementary School, West Hoke Middle, and Hoke County High.
Ownership History
Date
Name
Owned For
Owner Type
Purchase Details
Closed on
Oct 17, 2025
Sold by
Mcneil Jeffrey A and Mcneil Teresa A
Bought by
Mcneil Mitchell
Current Estimated Value
Home Financials for this Owner
Home Financials are based on the most recent Mortgage that was taken out on this home.
Original Mortgage
$209,407
Outstanding Balance
$209,407
Interest Rate
6.5%
Mortgage Type
VA
Estimated Equity
$20,962
Purchase Details
Closed on
Feb 19, 2021
Sold by
Britt Robert H and Britt Jane P
Bought by
Mcneil Jeffrey A and Mcneil Teresa A
Home Financials for this Owner
Home Financials are based on the most recent Mortgage that was taken out on this home.
Original Mortgage
$170,050
Interest Rate
2.65%
Mortgage Type
New Conventional
Create a Home Valuation Report for This Property
The Home Valuation Report is an in-depth analysis detailing your home's value as well as a comparison with similar homes in the area
Home Values in the Area
Average Home Value in this Area
Purchase History
| Date | Buyer | Sale Price | Title Company |
|---|---|---|---|
| Mcneil Mitchell | $205,000 | None Listed On Document | |
| Mcneil Jeffrey A | $179,000 | None Available |
Source: Public Records
Mortgage History
| Date | Status | Borrower | Loan Amount |
|---|---|---|---|
| Open | Mcneil Mitchell | $209,407 | |
| Previous Owner | Mcneil Jeffrey A | $170,050 |
Source: Public Records
Tax History
| Year | Tax Paid | Tax Assessment Tax Assessment Total Assessment is a certain percentage of the fair market value that is determined by local assessors to be the total taxable value of land and additions on the property. | Land | Improvement |
|---|---|---|---|---|
| 2025 | $1,398 | $191,480 | $45,650 | $145,830 |
| 2024 | $1,398 | $191,480 | $45,650 | $145,830 |
| 2023 | $1,398 | $191,480 | $45,650 | $145,830 |
| 2022 | $1,370 | $191,480 | $45,650 | $145,830 |
| 2021 | $1,166 | $158,670 | $36,040 | $122,630 |
| 2020 | $1,190 | $158,670 | $36,040 | $122,630 |
| 2019 | $1,190 | $158,670 | $36,040 | $122,630 |
| 2018 | $1,190 | $158,670 | $36,040 | $122,630 |
| 2017 | $1,190 | $158,670 | $36,040 | $122,630 |
| 2016 | $1,166 | $158,670 | $36,040 | $122,630 |
| 2015 | $1,166 | $158,670 | $36,040 | $122,630 |
| 2014 | $1,158 | $158,670 | $36,040 | $122,630 |
| 2013 | -- | $140,650 | $28,830 | $111,820 |
Source: Public Records
Map
Nearby Homes
- 823 E Donaldson Ave
- 912 Lewis St
- 804 Saunders St
- 125 Crawford St
- 908 E Prospect Ave
- 507 N Jackson St
- 812 N Jackson St
- 3 Polaris Ct
- 0 Lot 4 Polaris Ct
- 502 N Stewart St
- 433 Cumberland Ave
- 109 E 6th Ave
- 209 E Elwood Ave
- 416 N Main St
- 427 Jones Ave
- 215 Brickendon Ln
- 912 N Main St
- 244 Cambray Downs (Lot 10) Ct
- 190 Cambray Downs (Lot 6) Ct
- 270 Cambray Downs (Lot 12) Ct
Your Personal Tour Guide
Ask me questions while you tour the home.