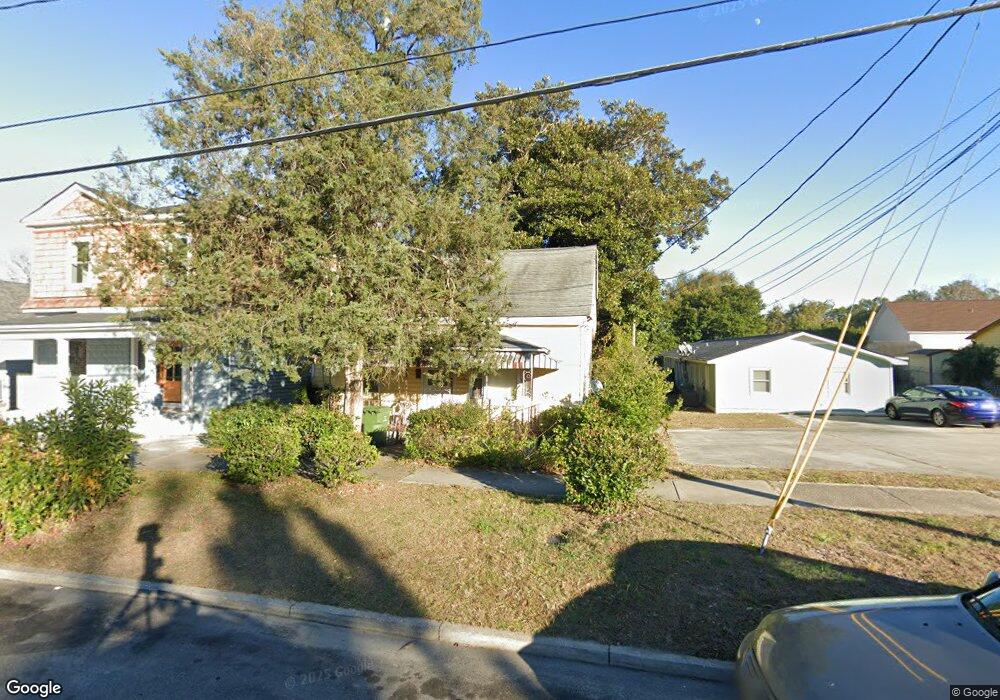
610 Mcrae St Wilmington, NC 28401
Northside NeighborhoodEstimated Value: $212,000 - $246,000
2
Beds
1
Bath
818
Sq Ft
$279/Sq Ft
Est. Value
About This Home
This home is located at 610 Mcrae St, Wilmington, NC 28401 and is currently estimated at $228,195, approximately $278 per square foot. 610 Mcrae St is a home located in New Hanover County with nearby schools including Snipes Academy of Arts & Design, Williston Middle School, and New Hanover High School.
Ownership History
Date
Name
Owned For
Owner Type
Purchase Details
Closed on
Jan 1, 2001
Bought by
Robinson Annie
Current Estimated Value
Purchase Details
Closed on
Feb 28, 1992
Sold by
Nationsbank Of North Carolina
Bought by
Hawkins Gary
Purchase Details
Closed on
Feb 3, 1992
Sold by
Ncnb National Bank Of Nc
Bought by
Nationsbank Of North Carolina
Purchase Details
Closed on
May 20, 1991
Sold by
Butler Jr Algernon L
Bought by
Ncnb National Bank Of Nc
Purchase Details
Closed on
May 1, 1988
Sold by
Robinson Annie
Bought by
Broach Michael D Lindy
Create a Home Valuation Report for This Property
The Home Valuation Report is an in-depth analysis detailing your home's value as well as a comparison with similar homes in the area
Home Values in the Area
Average Home Value in this Area
Purchase History
| Date | Buyer | Sale Price | Title Company |
|---|---|---|---|
| Robinson Annie | -- | -- | |
| Hawkins Gary | $4,500 | -- | |
| Nationsbank Of North Carolina | -- | -- | |
| Ncnb National Bank Of Nc | $10,000 | -- | |
| Broach Michael D Lindy | $6,500 | -- |
Source: Public Records
Tax History Compared to Growth
Tax History
| Year | Tax Paid | Tax Assessment Tax Assessment Total Assessment is a certain percentage of the fair market value that is determined by local assessors to be the total taxable value of land and additions on the property. | Land | Improvement |
|---|---|---|---|---|
| 2025 | $465 | $151,500 | $111,500 | $40,000 |
| 2023 | $465 | $107,000 | $40,200 | $66,800 |
| 2022 | $910 | $107,000 | $40,200 | $66,800 |
| 2021 | $229 | $107,000 | $40,200 | $66,800 |
| 2020 | $528 | $50,100 | $28,400 | $21,700 |
| 2019 | $528 | $50,100 | $28,400 | $21,700 |
| 2018 | $528 | $50,100 | $28,400 | $21,700 |
| 2017 | $528 | $50,100 | $28,400 | $21,700 |
| 2016 | $652 | $58,800 | $26,600 | $32,200 |
| 2015 | $623 | $58,800 | $26,600 | $32,200 |
| 2014 | $596 | $58,800 | $26,600 | $32,200 |
Source: Public Records
Map
Nearby Homes