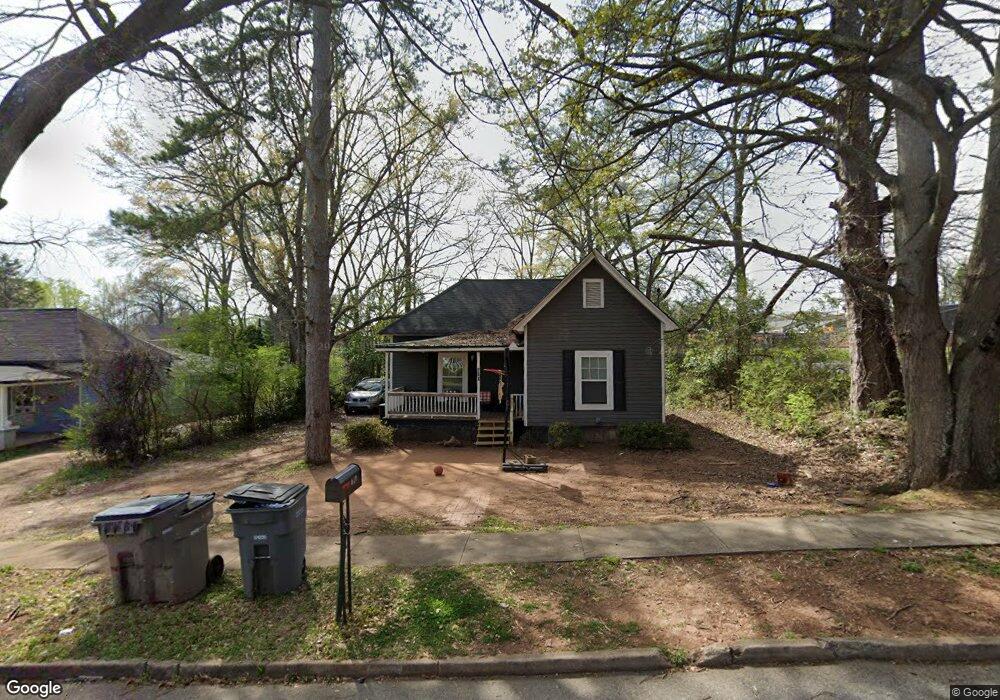
610 Murphy Ave Lagrange, GA 30240
Estimated Value: $55,000 - $132,000
2
Beds
1
Bath
1,002
Sq Ft
$83/Sq Ft
Est. Value
About This Home
This home is located at 610 Murphy Ave, Lagrange, GA 30240 and is currently estimated at $83,130, approximately $82 per square foot. 610 Murphy Ave is a home located in Troup County with nearby schools including Ethel W. Kight Elementary School, Hollis Hand Elementary School, and Franklin Forest Elementary School.
Ownership History
Date
Name
Owned For
Owner Type
Purchase Details
Closed on
Dec 23, 2008
Sold by
Jenefsky Micheal Sue
Bought by
Cavender Ronald S
Current Estimated Value
Home Financials for this Owner
Home Financials are based on the most recent Mortgage that was taken out on this home.
Original Mortgage
$36,300
Outstanding Balance
$23,476
Interest Rate
5.95%
Mortgage Type
New Conventional
Estimated Equity
$59,654
Purchase Details
Closed on
Oct 31, 2002
Sold by
Don Rainey Food Store
Bought by
Michael Sue Jenefsky
Purchase Details
Closed on
Mar 16, 1989
Sold by
Mallory Arthur E
Bought by
Don Rainey Food Store
Purchase Details
Closed on
Apr 2, 1970
Sold by
Rainey Donald L
Bought by
Mallory Arthur E
Purchase Details
Closed on
Apr 1, 1970
Sold by
Cosper Woodrow
Bought by
Rainey Donald L
Purchase Details
Closed on
Dec 1, 1966
Sold by
Blankinship Carrie S
Bought by
Nichols
Create a Home Valuation Report for This Property
The Home Valuation Report is an in-depth analysis detailing your home's value as well as a comparison with similar homes in the area
Purchase History
| Date | Buyer | Sale Price | Title Company |
|---|---|---|---|
| Cavender Ronald S | $11,500 | -- | |
| Michael Sue Jenefsky | $24,000 | -- | |
| Don Rainey Food Store | $7,500 | -- | |
| Mallory Arthur E | $4,000 | -- | |
| Rainey Donald L | $4,000 | -- | |
| Cosper Woodrow | -- | -- | |
| Nichols | -- | -- |
Source: Public Records
Mortgage History
| Date | Status | Borrower | Loan Amount |
|---|---|---|---|
| Open | Cavender Ronald S | $36,300 |
Source: Public Records
Tax History
| Year | Tax Paid | Tax Assessment Tax Assessment Total Assessment is a certain percentage of the fair market value that is determined by local assessors to be the total taxable value of land and additions on the property. | Land | Improvement |
|---|---|---|---|---|
| 2025 | $710 | $26,040 | $3,520 | $22,520 |
| 2024 | $617 | $22,640 | $3,520 | $19,120 |
| 2023 | $551 | $20,200 | $3,520 | $16,680 |
| 2022 | $533 | $19,080 | $3,520 | $15,560 |
| 2021 | $292 | $9,680 | $3,520 | $6,160 |
| 2020 | $257 | $8,520 | $2,360 | $6,160 |
| 2019 | $238 | $7,880 | $1,880 | $6,000 |
| 2018 | $238 | $7,880 | $1,880 | $6,000 |
| 2017 | $238 | $7,880 | $1,880 | $6,000 |
| 2016 | $232 | $7,691 | $1,770 | $5,921 |
| 2015 | $232 | $7,691 | $1,770 | $5,921 |
| 2014 | $233 | $7,691 | $1,770 | $5,921 |
| 2013 | -- | $9,600 | $2,195 | $7,405 |
Source: Public Records
Map
Nearby Homes
- 207 Wilkes St
- 600 Park Ave
- 421 College Ave
- 304 Boulevard
- 403 College Ave
- 812 Elm St
- 208 Boulevard
- 606 Poplar St
- 914 Todd St
- 509 S Lewis St
- 505 S Lewis St
- 1004 Callaway Ave
- 405 W Broome St Unit 2
- 405 W Broome St Unit 3
- 405 W Broome St Unit 4
- 405 W Broome St Unit 1
- 405 W Broome St Unit 5
- 501 Milam St
- 517 Jefferson St
- 217 Jefferson St
Your Personal Tour Guide
Ask me questions while you tour the home.