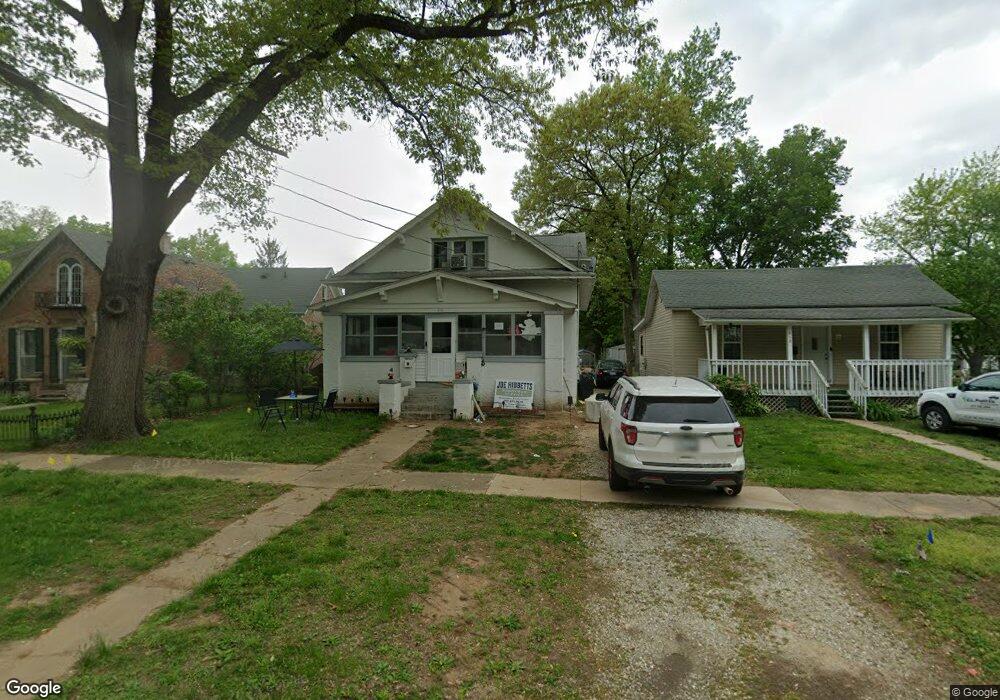
610 N Plum St Havana, IL 62644
Estimated Value: $111,000 - $119,000
6
Beds
1
Bath
1,987
Sq Ft
$57/Sq Ft
Est. Value
About This Home
This home is located at 610 N Plum St, Havana, IL 62644 and is currently estimated at $113,883, approximately $57 per square foot. 610 N Plum St is a home located in Mason County with nearby schools including Havana Junior High School, New Central Elementary School, and Havana High School.
Ownership History
Date
Name
Owned For
Owner Type
Purchase Details
Closed on
Apr 12, 2022
Sold by
North Illinois Investments Llc
Bought by
Sconzo Vincent
Current Estimated Value
Purchase Details
Closed on
Nov 16, 2020
Sold by
Mason County
Bought by
North Illinois Investments Llc
Purchase Details
Closed on
Aug 24, 2020
Sold by
Carlson Duane
Bought by
County Of Mason and Trust No 04 36 413 007
Purchase Details
Closed on
Mar 21, 2013
Sold by
Us Bank Na Nd
Bought by
Carlson Duane
Purchase Details
Closed on
Oct 10, 2012
Sold by
Towery Cari
Bought by
Us Bank National Associtin Nd
Purchase Details
Closed on
Feb 20, 2007
Sold by
Towery Vivian J and Towery Wilard M
Bought by
Towery Cari and Towery Robert S
Home Financials for this Owner
Home Financials are based on the most recent Mortgage that was taken out on this home.
Original Mortgage
$75,000
Interest Rate
6.23%
Mortgage Type
New Conventional
Create a Home Valuation Report for This Property
The Home Valuation Report is an in-depth analysis detailing your home's value as well as a comparison with similar homes in the area
Home Values in the Area
Average Home Value in this Area
Purchase History
| Date | Buyer | Sale Price | Title Company |
|---|---|---|---|
| Sconzo Vincent | -- | None Listed On Document | |
| North Illinois Investments Llc | -- | Attorney | |
| County Of Mason | -- | Attorney | |
| Carlson Duane | $5,000 | Peakin Title | |
| Us Bank National Associtin Nd | -- | None Available | |
| Towery Cari | $75,000 | Riverland Title Inc |
Source: Public Records
Mortgage History
| Date | Status | Borrower | Loan Amount |
|---|---|---|---|
| Previous Owner | Towery Cari | $75,000 |
Source: Public Records
Tax History Compared to Growth
Tax History
| Year | Tax Paid | Tax Assessment Tax Assessment Total Assessment is a certain percentage of the fair market value that is determined by local assessors to be the total taxable value of land and additions on the property. | Land | Improvement |
|---|---|---|---|---|
| 2024 | $2,863 | $27,314 | $3,284 | $24,030 |
| 2023 | $2,863 | $26,429 | $3,178 | $23,251 |
| 2022 | $2,959 | $25,641 | $3,083 | $22,558 |
| 2021 | $3,101 | $23,763 | $2,857 | $20,906 |
| 2020 | $0 | $0 | $0 | $0 |
| 2019 | $3,075 | $23,763 | $2,857 | $20,906 |
| 2018 | $3,045 | $23,763 | $2,857 | $20,906 |
| 2017 | $3,028 | $23,763 | $2,857 | $20,906 |
| 2016 | $3,006 | $23,763 | $2,857 | $20,906 |
| 2015 | $2,122 | $23,763 | $2,857 | $20,906 |
| 2012 | $2,122 | $23,763 | $2,857 | $20,906 |
Source: Public Records
Map
Nearby Homes
- 118 W Clark St
- 415 N Plum St
- 813 N Broadway St
- 420 N Pearl St
- 849 N Broadway St
- 220 S Orange St
- 306 S Orange St
- 526 E Main St
- 327 S Orange St
- 608 E Main St
- 426 S Orange St
- 587 S Plum St
- 525 S Pearl St
- 611 S Broadway St
- 337 E Windsor St
- 700 S Promenade St
- 806 S Lincoln St
- 814 S Lincoln St
- 702&704 Coleman St
- 827 S 10th St