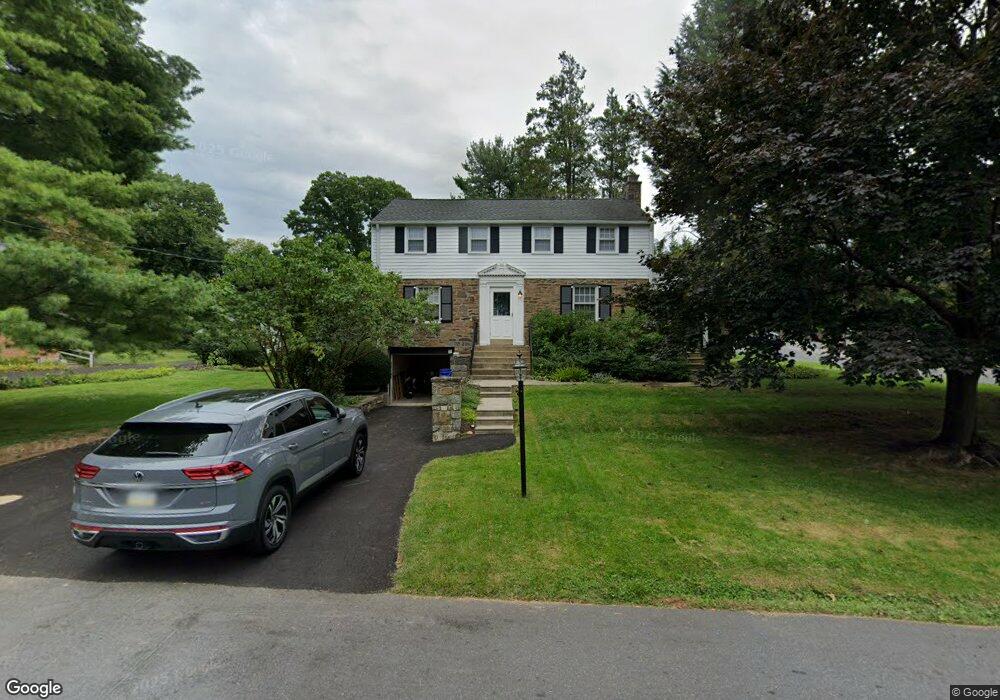
610 Pennsylvania Ave Unit 18 Oreland, PA 19075
Estimated Value: $330,000 - $538,000
3
Beds
2
Baths
1,820
Sq Ft
$258/Sq Ft
Est. Value
About This Home
This home is located at 610 Pennsylvania Ave Unit 18, Oreland, PA 19075 and is currently estimated at $469,882, approximately $258 per square foot. 610 Pennsylvania Ave Unit 18 is a home located in Montgomery County with nearby schools including Jarrettown Elementary School, Sandy Run Middle School, and Upper Dublin High School.
Ownership History
Date
Name
Owned For
Owner Type
Purchase Details
Closed on
Nov 4, 2024
Sold by
Billitto Joseph P and Billitto Megan Minner
Bought by
Cantrell Jordan M and Cantrell Catherine L
Current Estimated Value
Purchase Details
Closed on
Oct 6, 2021
Sold by
Pero Joseph J
Bought by
Biiiitto Joseph Paul and Biiiitto Megan Minner
Home Financials for this Owner
Home Financials are based on the most recent Mortgage that was taken out on this home.
Original Mortgage
$369,000
Interest Rate
2.8%
Mortgage Type
Balloon
Purchase Details
Closed on
Aug 15, 1996
Sold by
Pero Joseph J and Walton Annmarie C
Bought by
Pero Joseph J and Pero Annmarie Walton
Purchase Details
Closed on
Jul 7, 1995
Sold by
Graffious William J and Graffious Harriet D
Bought by
Pero Joseph J and Walton Annmarie C
Create a Home Valuation Report for This Property
The Home Valuation Report is an in-depth analysis detailing your home's value as well as a comparison with similar homes in the area
Home Values in the Area
Average Home Value in this Area
Purchase History
| Date | Buyer | Sale Price | Title Company |
|---|---|---|---|
| Cantrell Jordan M | $480,000 | None Listed On Document | |
| Cantrell Jordan M | $480,000 | None Listed On Document | |
| Biiiitto Joseph Paul | $410,000 | None Listed On Document | |
| Pero Joseph J | -- | -- | |
| Pero Joseph J | $170,000 | -- |
Source: Public Records
Mortgage History
| Date | Status | Borrower | Loan Amount |
|---|---|---|---|
| Previous Owner | Biiiitto Joseph Paul | $369,000 |
Source: Public Records
Tax History Compared to Growth
Tax History
| Year | Tax Paid | Tax Assessment Tax Assessment Total Assessment is a certain percentage of the fair market value that is determined by local assessors to be the total taxable value of land and additions on the property. | Land | Improvement |
|---|---|---|---|---|
| 2025 | $7,152 | $146,670 | $58,140 | $88,530 |
| 2024 | $7,152 | $146,670 | $58,140 | $88,530 |
| 2023 | $6,985 | $146,670 | $58,140 | $88,530 |
| 2022 | $6,833 | $146,670 | $58,140 | $88,530 |
| 2021 | $6,663 | $146,670 | $58,140 | $88,530 |
| 2020 | $6,470 | $146,670 | $58,140 | $88,530 |
| 2019 | $6,362 | $146,670 | $58,140 | $88,530 |
| 2018 | $6,361 | $146,670 | $58,140 | $88,530 |
| 2017 | $6,130 | $146,670 | $58,140 | $88,530 |
| 2016 | $6,072 | $146,670 | $58,140 | $88,530 |
| 2015 | $5,736 | $146,670 | $58,140 | $88,530 |
| 2014 | $5,736 | $146,670 | $58,140 | $88,530 |
Source: Public Records
Map
Nearby Homes
- 10 Ronald Cir
- 1313 Bruce Rd
- 1901 Pennsylvania Ave
- 101 Orlando Ave
- 116 Twining Rd
- 118 Twining Rd
- 238 Plymouth Ave
- 122 Garden Rd
- 200 Redford Rd
- 300 Lorraine Ave
- 223 Orlemann Ave
- 220 Garth Rd
- 231 Montgomery Ave
- 324 Valley Rd
- 160 Camp Hill Rd
- 314 Girard Ave
- 162 Logan Ave
- 0 Girard Ave
- 0 Logan Ave Unit PAMC2112680
- 120 Linden Ave