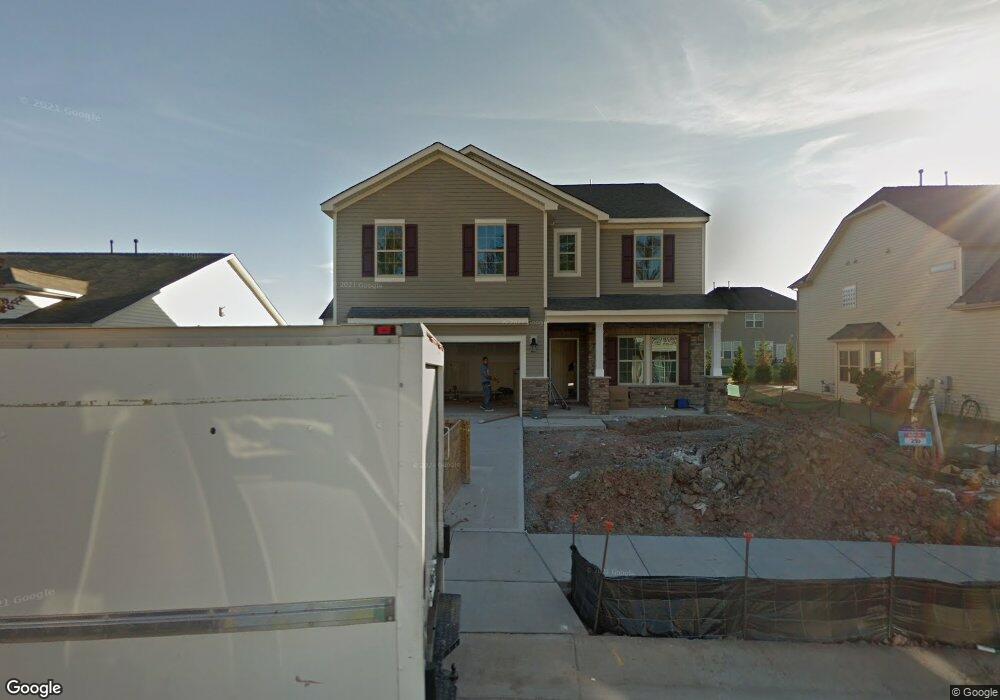
610 Poplar St Durham, NC 27703
Eastern Durham NeighborhoodEstimated Value: $477,000 - $509,000
5
Beds
3
Baths
2,616
Sq Ft
$188/Sq Ft
Est. Value
About This Home
This home is located at 610 Poplar St, Durham, NC 27703 and is currently estimated at $490,563, approximately $187 per square foot. 610 Poplar St is a home located in Durham County with nearby schools including Spring Valley Elementary School, John W Neal Middle School, and Southern School of Energy & Sustainability.
Ownership History
Date
Name
Owned For
Owner Type
Purchase Details
Closed on
Dec 15, 2016
Sold by
Calatlantic Grp Inc
Bought by
Kerr Lutron K and Kerr Nancy J
Current Estimated Value
Home Financials for this Owner
Home Financials are based on the most recent Mortgage that was taken out on this home.
Original Mortgage
$267,227
Outstanding Balance
$216,445
Interest Rate
3.62%
Mortgage Type
FHA
Estimated Equity
$274,118
Purchase Details
Closed on
Dec 5, 2013
Sold by
Winstar Homes At Brightwood Trails Llc
Bought by
Gk Brightwood Lllp
Purchase Details
Closed on
Dec 22, 2010
Sold by
Gk Brightwood Lllp
Bought by
Winstar Homes At Brightwood Trails Llc
Home Financials for this Owner
Home Financials are based on the most recent Mortgage that was taken out on this home.
Original Mortgage
$715,000
Interest Rate
4.18%
Mortgage Type
Seller Take Back
Purchase Details
Closed on
Apr 20, 2010
Sold by
St Lawrence Homes Inc
Bought by
Rj Brightwood Llc
Create a Home Valuation Report for This Property
The Home Valuation Report is an in-depth analysis detailing your home's value as well as a comparison with similar homes in the area
Home Values in the Area
Average Home Value in this Area
Purchase History
| Date | Buyer | Sale Price | Title Company |
|---|---|---|---|
| Kerr Lutron K | $273,000 | -- | |
| Gk Brightwood Lllp | $94,000 | None Available | |
| Winstar Homes At Brightwood Trails Llc | $840,000 | None Available | |
| Rj Brightwood Llc | -- | None Available |
Source: Public Records
Mortgage History
| Date | Status | Borrower | Loan Amount |
|---|---|---|---|
| Open | Kerr Lutron K | $267,227 | |
| Previous Owner | Winstar Homes At Brightwood Trails Llc | $715,000 |
Source: Public Records
Tax History
| Year | Tax Paid | Tax Assessment Tax Assessment Total Assessment is a certain percentage of the fair market value that is determined by local assessors to be the total taxable value of land and additions on the property. | Land | Improvement |
|---|---|---|---|---|
| 2025 | $5,298 | $534,467 | $101,500 | $432,967 |
| 2024 | $4,198 | $300,963 | $52,290 | $248,673 |
| 2023 | $3,942 | $300,963 | $52,290 | $248,673 |
| 2022 | $3,852 | $300,963 | $52,290 | $248,673 |
| 2021 | $3,834 | $300,963 | $52,290 | $248,673 |
| 2020 | $3,744 | $300,963 | $52,290 | $248,673 |
| 2019 | $3,744 | $300,963 | $52,290 | $248,673 |
| 2018 | $3,451 | $254,420 | $46,480 | $207,940 |
| 2017 | $2,867 | $212,933 | $46,480 | $166,453 |
| 2016 | $605 | $46,480 | $46,480 | $0 |
| 2015 | $582 | $42,045 | $42,045 | $0 |
| 2014 | $582 | $42,045 | $42,045 | $0 |
Source: Public Records
Map
Nearby Homes
- 807 Outlaw Ave
- 1114 Blackthorn Ln
- 807 Outlaw Ave Unit 19
- 2208 Gilman St
- 13 Blackthorn Ln
- 17 Plumleaf Ln
- The Poplar Plan at Sherron Road Townes
- 528 Plumleaf Ln
- 517 Keith St
- 428 Holly Blossom Dr
- 621 Wellwater Ave
- 442 Gus Rd
- 1200 Constellation Cir
- 1128 Constellation Cir
- 1126 Constellation Cir
- 1124 Constellation Cir
- 1108 Constellation Cir
- 1114 Constellation Cir
- 1112 Constellation Cir
- Landrum III Plan at Stella View - Summit Collection