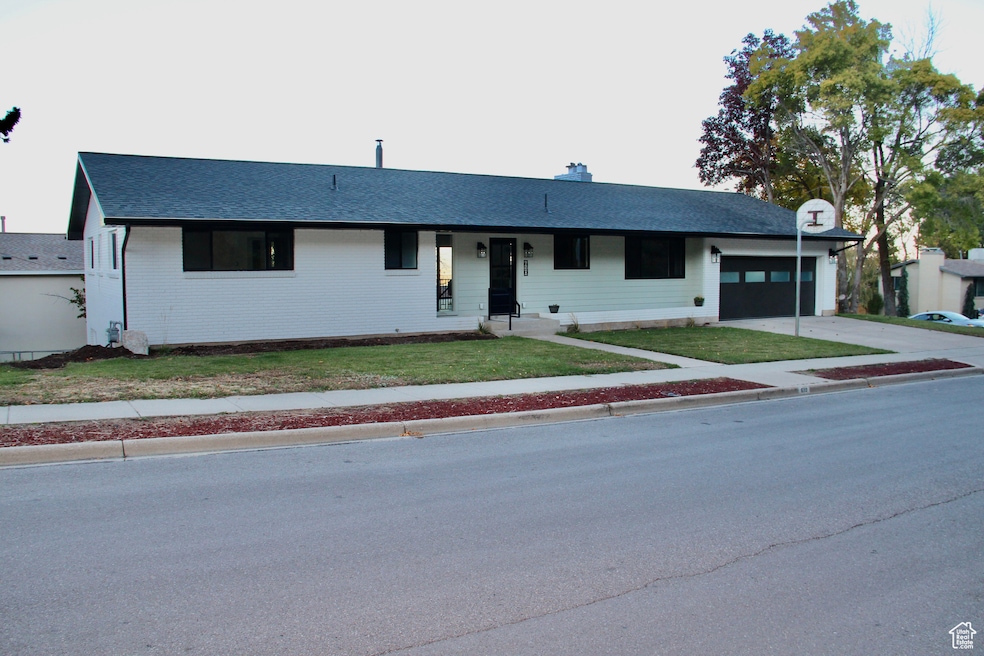
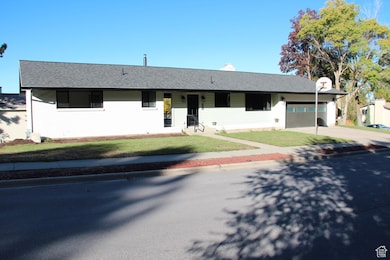
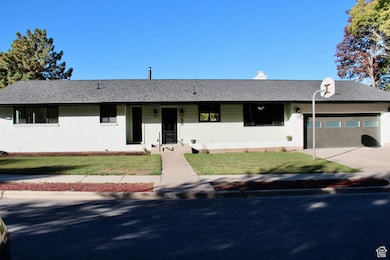
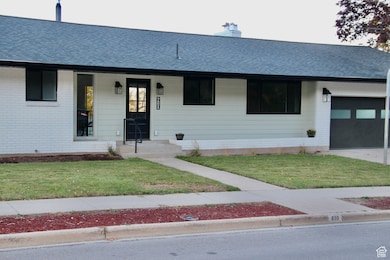
610 S 800 E Centerville, UT 84014
Estimated payment $4,418/month
Highlights
- Second Kitchen
- RV Access or Parking
- Wood Flooring
- J A Taylor Elementary School Rated A-
- Rambler Architecture
- Main Floor Primary Bedroom
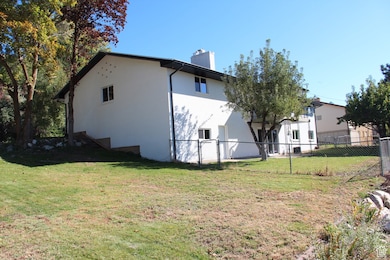
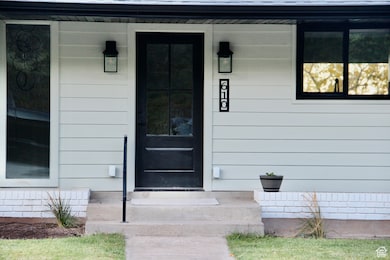
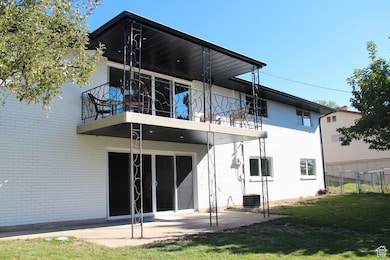
About This Home
Welcome to this beautifully fully refurbished home, where modern design meets worry-free living. Every inch of this property has been meticulously updated-from the roof to the flooring, offering the benefits of a brand-new home with the character and charm of an established neighborhood. Step inside to discover: Move-in ready luxury finishes Brand-new kitchen with high-end appliances, cabinetry, and countertops Updated bathrooms featuring spa-like fixtures Energy-efficient systems and windows to save on utility costs Open-concept layout perfect for modern living and entertaining This isn't just a renovation-it's a complete transformation designed for comfort, style, and peace of mind. All the work has already been done for you, so you can simply move in and start enjoying your new home from day one." Home features a tankless hot water system, elegant quartz countertops, and a beautifully designed mother-in-law suite, awesome oversized garage with work shop. This home offers both comfort and versatility. Enjoy an unbeatable location just moments from Island View Park, where you'll find pickleball and tennis courts, as well as a playground for all ages.
Listing Agent
Zachary Black
Equity Real Estate (Premier Elite) License #6040792 Listed on: 10/23/2025
Home Details
Home Type
- Single Family
Est. Annual Taxes
- $3,606
Year Built
- Built in 1973
Lot Details
- 10,454 Sq Ft Lot
- Partially Fenced Property
- Landscaped
- Corner Lot
- Property is zoned Single-Family, R-L
Parking
- 2 Car Attached Garage
- RV Access or Parking
Home Design
- Rambler Architecture
- Brick Exterior Construction
- Membrane Roofing
- Asphalt Roof
- Cement Siding
Interior Spaces
- 3,600 Sq Ft Home
- 2-Story Property
- 2 Fireplaces
- Double Pane Windows
- Sliding Doors
- Great Room
- Gas Dryer Hookup
Kitchen
- Second Kitchen
- Gas Range
- Free-Standing Range
- Disposal
Flooring
- Wood
- Carpet
- Tile
Bedrooms and Bathrooms
- 6 Bedrooms | 3 Main Level Bedrooms
- Primary Bedroom on Main
- In-Law or Guest Suite
Basement
- Walk-Out Basement
- Exterior Basement Entry
- Apartment Living Space in Basement
- Natural lighting in basement
Accessible Home Design
- Roll-in Shower
- Accessible Hallway
Eco-Friendly Details
- Reclaimed Water Irrigation System
Outdoor Features
- Exterior Lighting
- Basketball Hoop
Schools
- J A Taylor Elementary School
- Centerville Middle School
- Viewmont High School
Utilities
- Central Air
- Radiant Heating System
- Natural Gas Connected
- Water Softener is Owned
Community Details
- No Home Owners Association
- Island View Sub Subdivision
Listing and Financial Details
- Assessor Parcel Number 02-072-0011
Map
Tax History
| Year | Tax Paid | Tax Assessment Tax Assessment Total Assessment is a certain percentage of the fair market value that is determined by local assessors to be the total taxable value of land and additions on the property. | Land | Improvement |
|---|---|---|---|---|
| 2025 | $3,789 | $362,450 | $167,045 | $195,405 |
| 2024 | $3,607 | $350,900 | $151,137 | $199,763 |
| 2023 | $3,351 | $589,000 | $246,610 | $342,390 |
| 2022 | $3,551 | $343,751 | $124,790 | $218,961 |
| 2021 | $3,157 | $476,000 | $191,898 | $284,102 |
| 2020 | $2,733 | $412,000 | $186,728 | $225,272 |
| 2019 | $2,751 | $405,000 | $184,832 | $220,168 |
| 2018 | $2,578 | $375,000 | $171,380 | $203,620 |
| 2016 | $2,222 | $179,630 | $58,805 | $120,825 |
| 2015 | $2,134 | $162,745 | $58,805 | $103,940 |
| 2014 | $1,896 | $147,955 | $58,805 | $89,150 |
| 2013 | -- | $145,347 | $49,457 | $95,890 |
Property History
| Date | Event | Price | List to Sale | Price per Sq Ft |
|---|---|---|---|---|
| 01/14/2026 01/14/26 | Price Changed | $799,999 | -4.2% | $222 / Sq Ft |
| 11/19/2025 11/19/25 | Price Changed | $835,000 | -3.5% | $232 / Sq Ft |
| 10/23/2025 10/23/25 | For Sale | $865,000 | -- | $240 / Sq Ft |
Purchase History
| Date | Type | Sale Price | Title Company |
|---|---|---|---|
| Warranty Deed | -- | Gt Title Services | |
| Warranty Deed | -- | Backman Stewart Title Servic | |
| Warranty Deed | -- | Backman Stewart Title Servic |
Mortgage History
| Date | Status | Loan Amount | Loan Type |
|---|---|---|---|
| Open | $320,000 | New Conventional | |
| Closed | $180,000 | No Value Available | |
| Previous Owner | $165,300 | No Value Available | |
| Previous Owner | $152,000 | No Value Available |
Source: UtahRealEstate.com
MLS Number: 2119287
APN: 02-072-0011
Disclaimer: Certain information contained herein is derived from information provided by parties other than Homes.com. All information provided is deemed reliable, but is not guaranteed to be accurate and should be independently verified.
![]() IDX information is provided exclusively for consumers’ personal, non-commercial use, that it may not be used for any purpose other than to identify prospective properties consumers may be interested in purchasing, and that the data is deemed reliable but is not guaranteed accurate by the MLS. Licensor is only providing the MLS Content and not other sources of data provided in the Product.
IDX information is provided exclusively for consumers’ personal, non-commercial use, that it may not be used for any purpose other than to identify prospective properties consumers may be interested in purchasing, and that the data is deemed reliable but is not guaranteed accurate by the MLS. Licensor is only providing the MLS Content and not other sources of data provided in the Product.
Based on information from the Wasatch Front Regional Multiple Listing Service, Inc.. All data, including all measurements and calculations of area, is obtained from various sources and has not been, and will not be, verified by broker or the MLS. All information should be independently reviewed and verified for accuracy. Properties may or may not be listed by the office/agent presenting the information.
- 495 E 475 S
- 345 E 600 S
- 610 E Pages Ln
- 328 E 1100 S
- 360 E Center St
- 150 E 735 S Unit 23
- 967 S Courtyard Ln
- 252 N 400 E
- 662 E 1200 N
- 16 W 780 S
- 380 E 400 N
- 96 Village Square Rd
- 975 E 1050 N
- 88 W 50 S Unit C-3
- 88 W 50 S Unit B5
- 1420 N Main St
- 951 Centerville Commons Way
- 295 E 500 N
- 56 W 200 N
- 330 W Paradiso Ln
- 547 E 100 N
- 333 E 300 N Unit Rooms for Rent
- 1525 N Main St
- 270 E 400 N Unit A
- 1489 N 400 W Unit 1
- 830 N 500 W
- 1162 W 200 N
- 1343 N Deerfield Dr
- 305 N 1300 W
- 517 S 100 E
- 1628 S 500 E Unit Basement
- 1230 S 500 W
- 1289 S 675 W
- 467 W 1875 South S
- 2030 S Main St
- 931 Green Oaks Dr Unit Upstairs
- 2323 S 800 W
- 2520 S 500 W
- 739 S Rice Rd Unit B
- 850 N Highway 89
Ask me questions while you tour the home.