
Seller's Agent in 2025
Debra Oliver
SVN | North Star
(217) 637-2375
12 Total Sales

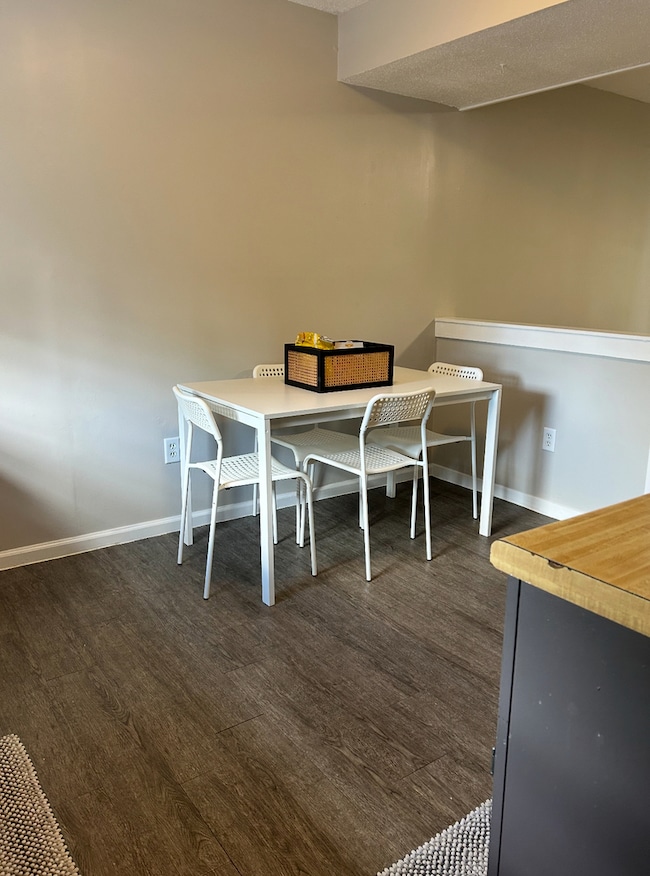

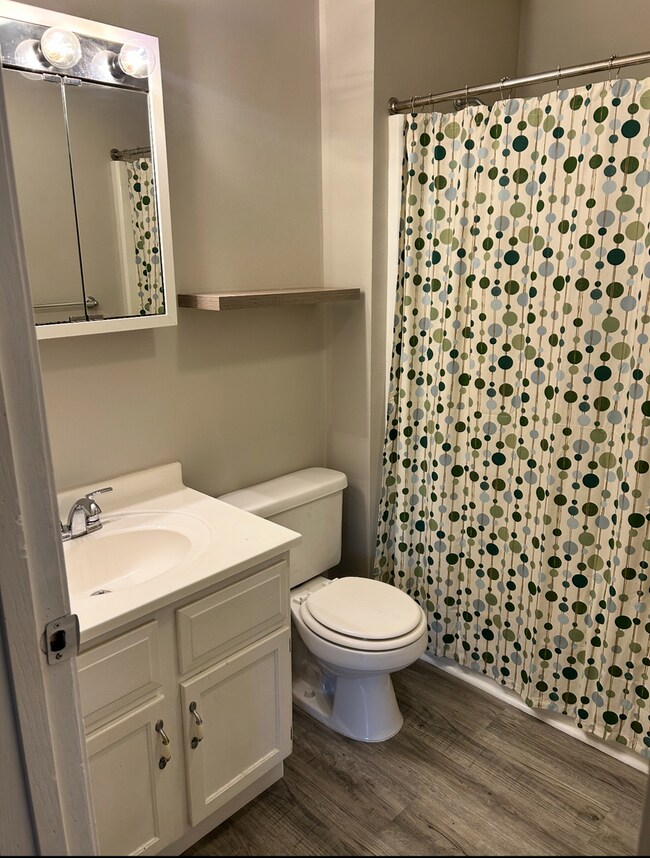
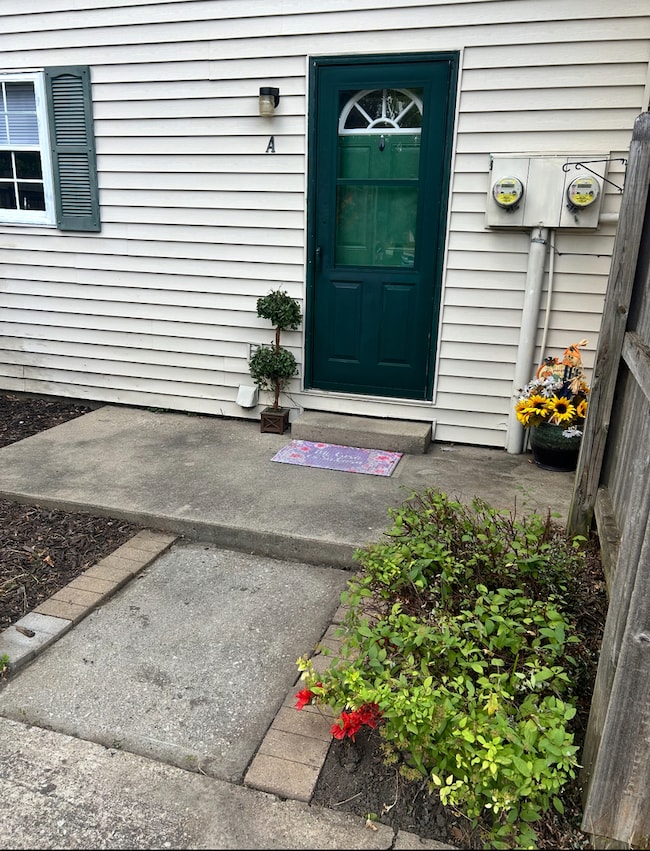
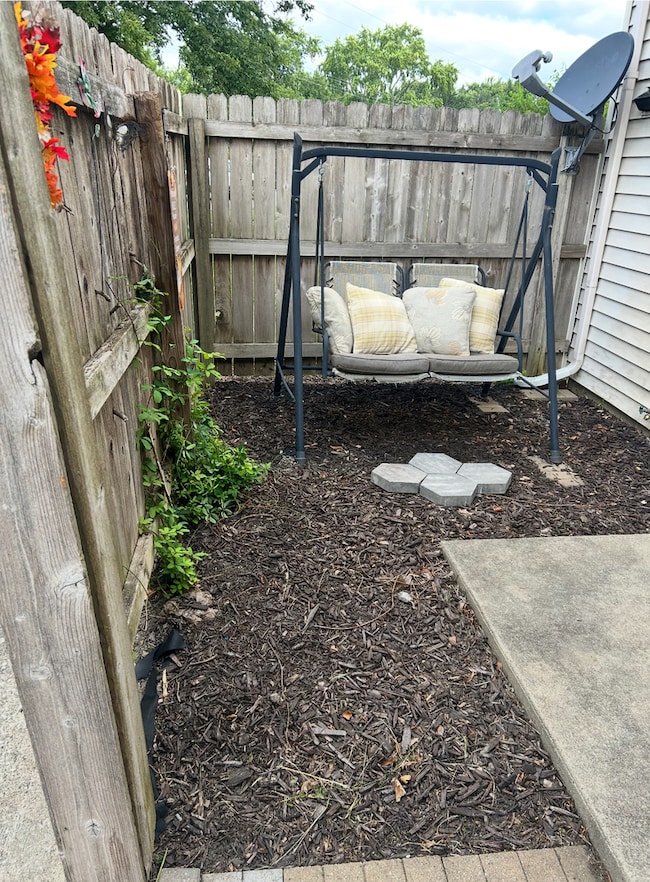
This unit is in great shape with many upgrades. 2 bedrooms, 1.5 bath home that is ready to be moved into. The condo has a newer HVAC, heat pump, air conditioning, luxury vinyl flooring, and newer carpet, light fixtures, appliances. The condo has a partially fenced patio and covered patio. Move in ready! Owner is a real estate broker. Units currently renting for 1200 per month approx. great investment opportunity. pre inspected no inspection contingencies.
Last Agent to Sell the Property
SVN | North Star License #475140962 Listed on: 09/03/2025
| Date | Type | Sale Price | Title Company |
|---|---|---|---|
| Warranty Deed | $103,500 | None Listed On Document | |
| Warranty Deed | -- | Attorney | |
| Warranty Deed | $72,000 | None Available | |
| Warranty Deed | $130,000 | -- | |
| Corporate Deed | $1,565,000 | -- |
| Date | Status | Loan Amount | Loan Type |
|---|---|---|---|
| Previous Owner | $35,000 | Fannie Mae Freddie Mac | |
| Previous Owner | $1,500,000 | Purchase Money Mortgage |
| Date | Event | Price | List to Sale | Price per Sq Ft |
|---|---|---|---|---|
| 12/15/2025 12/15/25 | Sold | $103,500 | -5.8% | $104 / Sq Ft |
| 11/12/2025 11/12/25 | Pending | -- | -- | -- |
| 09/28/2025 09/28/25 | For Sale | $109,900 | 0.0% | $110 / Sq Ft |
| 09/05/2025 09/05/25 | Pending | -- | -- | -- |
| 09/03/2025 09/03/25 | For Sale | $109,900 | -- | $110 / Sq Ft |
| Year | Tax Paid | Tax Assessment Tax Assessment Total Assessment is a certain percentage of the fair market value that is determined by local assessors to be the total taxable value of land and additions on the property. | Land | Improvement |
|---|---|---|---|---|
| 2024 | $1,268 | $15,440 | $2,990 | $12,450 |
| 2023 | $1,268 | $14,060 | $2,720 | $11,340 |
| 2022 | $1,193 | $12,970 | $2,510 | $10,460 |
| 2021 | $614 | $12,710 | $2,460 | $10,250 |
| 2020 | $615 | $12,710 | $2,460 | $10,250 |
| 2019 | $584 | $12,450 | $2,410 | $10,040 |
| 2018 | $562 | $12,250 | $2,370 | $9,880 |
| 2017 | $565 | $12,250 | $2,370 | $9,880 |
| 2016 | $496 | $12,000 | $2,320 | $9,680 |
| 2015 | $1,264 | $20,900 | $2,280 | $18,620 |
| 2014 | $1,253 | $20,900 | $2,280 | $18,620 |
| 2013 | $1,242 | $20,900 | $2,280 | $18,620 |
Seller's Agent in 2025
Debra Oliver
SVN | North Star
(217) 637-2375
12 Total Sales
Buyer's Agent in 2025
Delaney Sturner
Coldwell Banker R.E. Group
(217) 351-1988
75 Total Sales
Source: Midwest Real Estate Data (MRED)
MLS Number: 12254350
APN: 44-20-15-106-008
Disclaimer: Certain information contained herein is derived from information provided by parties other than Homes.com. All information provided is deemed reliable, but is not guaranteed to be accurate and should be independently verified.
![]() Based on information submitted to the MLS GRID. All data is obtained from various sources and may not have been verified by broker or MLS GRID. Supplied Open House Information is subject to change without notice. All information should be independently reviewed and verified for accuracy. Properties may or may not be listed by the office/agent presenting the information. Some IDX listings have been excluded from this website.
Based on information submitted to the MLS GRID. All data is obtained from various sources and may not have been verified by broker or MLS GRID. Supplied Open House Information is subject to change without notice. All information should be independently reviewed and verified for accuracy. Properties may or may not be listed by the office/agent presenting the information. Some IDX listings have been excluded from this website.
Based on information submitted to the MLS GRID
Ask me questions while you tour the home.