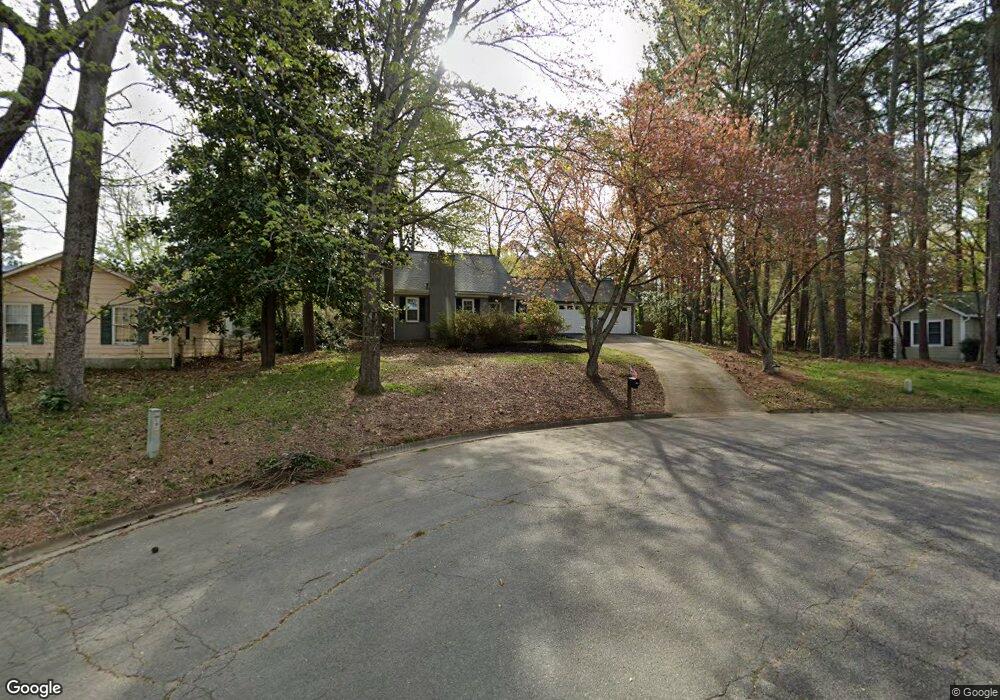
610 Tyson Ct Unit 2 Roswell, GA 30076
Estimated Value: $443,000 - $490,000
2
Beds
3
Baths
1,855
Sq Ft
$252/Sq Ft
Est. Value
About This Home
This home is located at 610 Tyson Ct Unit 2, Roswell, GA 30076 and is currently estimated at $468,224, approximately $252 per square foot. 610 Tyson Ct Unit 2 is a home located in Fulton County with nearby schools including Northwood Elementary School, Haynes Bridge Middle School, and Centennial High School.
Ownership History
Date
Name
Owned For
Owner Type
Purchase Details
Closed on
Dec 16, 2021
Sold by
Miles Brenda E
Bought by
Brenda Winberry Miles and Brenda Winberry Miles
Current Estimated Value
Purchase Details
Closed on
May 4, 1994
Sold by
Rush Bradley S
Bought by
Miles Brenda E
Home Financials for this Owner
Home Financials are based on the most recent Mortgage that was taken out on this home.
Original Mortgage
$105,050
Interest Rate
8.07%
Mortgage Type
FHA
Purchase Details
Closed on
Feb 9, 1994
Sold by
Jankowski Gale F
Bought by
Rush Bradley S
Purchase Details
Closed on
Apr 27, 1993
Sold by
Bailey Michael W Suzanne
Bought by
Jankowski Gale F
Home Financials for this Owner
Home Financials are based on the most recent Mortgage that was taken out on this home.
Original Mortgage
$105,050
Interest Rate
7.39%
Mortgage Type
FHA
Create a Home Valuation Report for This Property
The Home Valuation Report is an in-depth analysis detailing your home's value as well as a comparison with similar homes in the area
Home Values in the Area
Average Home Value in this Area
Purchase History
| Date | Buyer | Sale Price | Title Company |
|---|---|---|---|
| Brenda Winberry Miles | -- | -- | |
| Miles Brenda E | $19,800 | -- | |
| Rush Bradley S | $26,000 | -- | |
| Jankowski Gale F | $7,600 | -- |
Source: Public Records
Mortgage History
| Date | Status | Borrower | Loan Amount |
|---|---|---|---|
| Previous Owner | Miles Brenda E | $105,050 | |
| Previous Owner | Jankowski Gale F | $105,050 | |
| Closed | Rush Bradley S | $0 |
Source: Public Records
Tax History Compared to Growth
Tax History
| Year | Tax Paid | Tax Assessment Tax Assessment Total Assessment is a certain percentage of the fair market value that is determined by local assessors to be the total taxable value of land and additions on the property. | Land | Improvement |
|---|---|---|---|---|
| 2025 | $478 | $155,120 | $40,160 | $114,960 |
| 2023 | $4,393 | $155,640 | $40,880 | $114,760 |
| 2022 | $1,610 | $134,400 | $25,880 | $108,520 |
| 2021 | $2,122 | $114,000 | $29,480 | $84,520 |
| 2020 | $2,146 | $96,680 | $20,200 | $76,480 |
| 2019 | $360 | $96,680 | $20,200 | $76,480 |
| 2018 | $1,631 | $96,680 | $20,200 | $76,480 |
| 2017 | $1,690 | $69,880 | $12,800 | $57,080 |
| 2016 | $1,689 | $69,880 | $12,800 | $57,080 |
| 2015 | $2,067 | $69,880 | $12,800 | $57,080 |
| 2014 | $1,751 | $69,880 | $12,800 | $57,080 |
Source: Public Records
Map
Nearby Homes
- 115 Ansley Ct
- 1835 Old Alabama Rd
- 125 Maison Ct
- 500 Barrington Dr W
- 515 Forest Place
- 9985 Lake Forest Way
- 620 Lake Forest Ct
- 680 Barrington Way
- 650 Lake Forest Ct
- 1220 Terramont Dr
- 295 Crab Orchard Way
- 780 Crab Orchard Dr
- 105 Laurel Mill Ct
- 590 Ridgemont Dr
- 600 Jardin Ct Unit 48
- 485 Sheringham Ct
- 1050 Terramont Dr
- 2020 Jardin Ct Unit 1
- 620 Tyson Ct
- 600 Tyson Ct
- 570 Tyson Knolls
- 580 Tyson Knolls
- 580 Tyson Knoll
- 460 Tyson Cir
- 250 Tyson Cir Unit 2
- 450 Tyson Cir
- 270 Tyson Cir
- 625 Tyson Ct
- 480 Tyson Cir
- 240 Tyson Cir
- 440 Tyson Cir Unit 2
- 615 Tyson Ct
- 605 Tyson Ct
- 0 Tyson Cir Unit 7251353
- 0 Tyson Cir Unit 7258965
- 0 Tyson Cir Unit 7237294
- 0 Tyson Cir Unit 7156802
- 0 Tyson Cir Unit 7046383