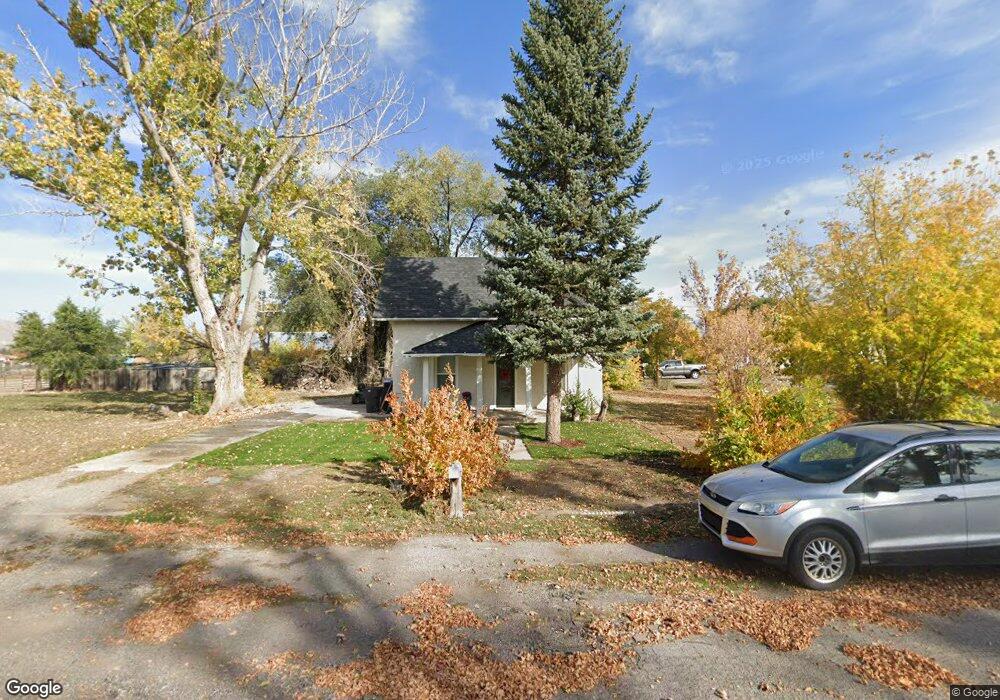
610 W 300 N Payson, UT 84651
Estimated Value: $372,000 - $383,000
3
Beds
1
Bath
1,164
Sq Ft
$323/Sq Ft
Est. Value
About This Home
This home is located at 610 W 300 N, Payson, UT 84651 and is currently estimated at $376,531, approximately $323 per square foot. 610 W 300 N is a home located in Utah County with nearby schools including Taylor Elementary School, Mt. Nebo Junior High School, and Salem Junior High School.
Ownership History
Date
Name
Owned For
Owner Type
Purchase Details
Closed on
Oct 22, 2019
Sold by
Truman Marketing Llc
Bought by
Butler Tyler Mckay
Current Estimated Value
Home Financials for this Owner
Home Financials are based on the most recent Mortgage that was taken out on this home.
Original Mortgage
$225,834
Outstanding Balance
$201,215
Interest Rate
4.37%
Mortgage Type
FHA
Estimated Equity
$175,316
Purchase Details
Closed on
Oct 15, 2015
Sold by
Nelson Gary Wayne W and Nelson Ada Mills
Bought by
Truman Marketing Llc
Home Financials for this Owner
Home Financials are based on the most recent Mortgage that was taken out on this home.
Original Mortgage
$123,669
Interest Rate
3.87%
Mortgage Type
Purchase Money Mortgage
Create a Home Valuation Report for This Property
The Home Valuation Report is an in-depth analysis detailing your home's value as well as a comparison with similar homes in the area
Home Values in the Area
Average Home Value in this Area
Purchase History
| Date | Buyer | Sale Price | Title Company |
|---|---|---|---|
| Butler Tyler Mckay | -- | Capstone T&E Inc | |
| Truman Marketing Llc | -- | Keystone Title Ins Agen |
Source: Public Records
Mortgage History
| Date | Status | Borrower | Loan Amount |
|---|---|---|---|
| Open | Butler Tyler Mckay | $225,834 | |
| Previous Owner | Truman Marketing Llc | $123,669 |
Source: Public Records
Tax History Compared to Growth
Tax History
| Year | Tax Paid | Tax Assessment Tax Assessment Total Assessment is a certain percentage of the fair market value that is determined by local assessors to be the total taxable value of land and additions on the property. | Land | Improvement |
|---|---|---|---|---|
| 2025 | $1,694 | $189,420 | $141,800 | $202,600 |
| 2024 | $1,694 | $172,370 | $0 | $0 |
| 2023 | $1,689 | $172,315 | $0 | $0 |
| 2022 | $1,875 | $188,155 | $0 | $0 |
| 2021 | $1,590 | $256,000 | $92,900 | $163,100 |
| 2020 | $1,474 | $232,100 | $80,800 | $151,300 |
| 2019 | $1,172 | $189,200 | $72,700 | $116,500 |
| 2018 | $1,045 | $162,700 | $61,400 | $101,300 |
| 2017 | $964 | $80,685 | $0 | $0 |
| 2016 | $874 | $72,710 | $0 | $0 |
| 2015 | $785 | $64,790 | $0 | $0 |
| 2014 | $752 | $62,590 | $0 | $0 |
Source: Public Records
Map
Nearby Homes
- 219 S Majestic W
- 383 W 625 N Unit A-D
- 384 W 650 N Unit A-D
- 84 W 400 N
- 361 W 625 N Unit A-D
- 9672 S 3550 W
- 533 S 700 W
- 528 S 800 W
- 244 E 300 N
- 116 E 100 S
- 387 N 300 E
- 115 N 300 E
- 527 S 1000 W
- 310 N 1500 W
- 1323 N 1390 E Unit 26-101
- 1287 N 1390 E Unit 25-96
- 610 S 800 W Unit 30
- 500 900 N
- 600 900 N
- 626 S 800 W Unit 32
- 325 N 600 W
- 308 N 600 W
- 343 N 600 W
- 297 N 600 W
- 326 N 600 W
- 340 N 600 W
- 371 N 600 W
- 9613 S 4400 W
- 1709 S Main St
- 1755 S Main St Unit 105
- 1793 S Main St Unit 107
- 1741 S Main St Unit 104
- 1771 S Main St Unit 106
- 1683 S Main St Unit 100
- 1723 S Main St Unit 103
- 1709 S Main St Unit 102
- 1683 S Main St Unit 101
- 379 N 600 W
- 785 W 400 N
- 352 N 600 W