Estimated Value: $170,873 - $209,000
--
Bed
5
Baths
1,176
Sq Ft
$165/Sq Ft
Est. Value
About This Home
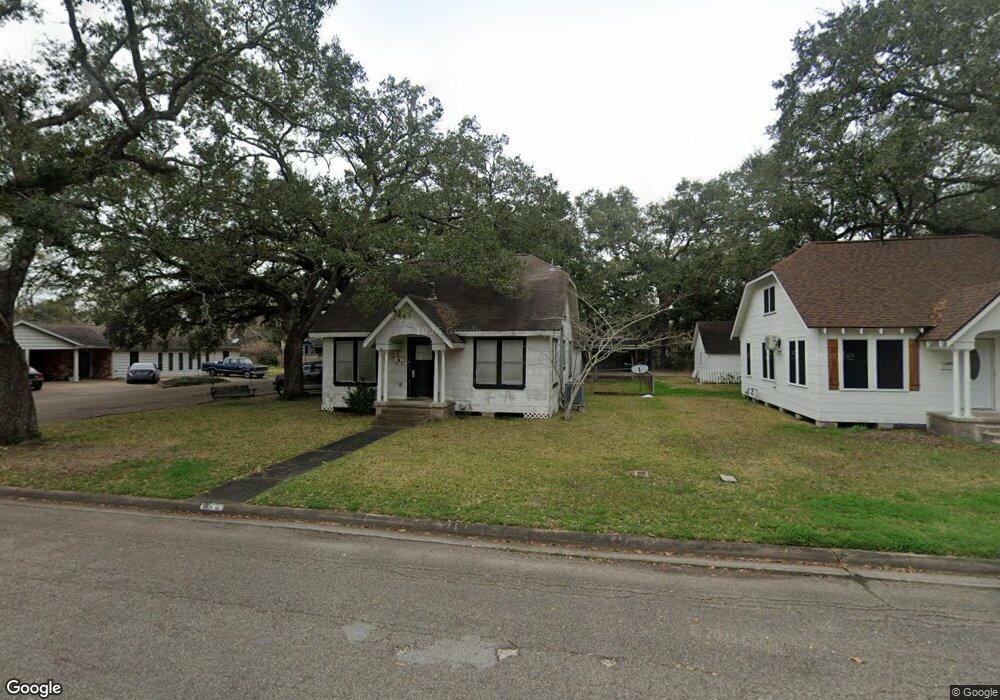
This home is located at 610 W Dumble St, Alvin, TX 77511 and is currently estimated at $193,968, approximately $164 per square foot. 610 W Dumble St is a home located in Brazoria County with nearby schools including Alvin Elementary School, Fairview Junior High School, and Alvin High School.
Ownership History
Date
Name
Owned For
Owner Type
Purchase Details
Closed on
May 28, 2020
Sold by
Mdcaniel Gaye Annette
Bought by
Hoisington Yvette
Current Estimated Value
Purchase Details
Closed on
May 22, 2020
Sold by
Mcdaniel Ryan and Mcdaniel Joanna
Bought by
Mcdaniel Gaye Annette
Purchase Details
Closed on
Feb 25, 2004
Sold by
Vandervort Gaye
Bought by
Mcdaniel Steven and Mcdaniel Gaye A
Home Financials for this Owner
Home Financials are based on the most recent Mortgage that was taken out on this home.
Original Mortgage
$56,000
Interest Rate
5.81%
Mortgage Type
Stand Alone First
Purchase Details
Closed on
May 11, 1994
Sold by
Pickens Joseph Luther and Pickens Annabel
Bought by
Vandervort Gaye A
Home Financials for this Owner
Home Financials are based on the most recent Mortgage that was taken out on this home.
Original Mortgage
$45,600
Interest Rate
8.03%
Create a Home Valuation Report for This Property
The Home Valuation Report is an in-depth analysis detailing your home's value as well as a comparison with similar homes in the area
Home Values in the Area
Average Home Value in this Area
Purchase History
| Date | Buyer | Sale Price | Title Company |
|---|---|---|---|
| Hoisington Yvette | -- | Stewart Title | |
| Mcdaniel Gaye Annette | -- | None Available | |
| Mcdaniel Steven | -- | -- | |
| Vandervort Gaye A | -- | -- |
Source: Public Records
Mortgage History
| Date | Status | Borrower | Loan Amount |
|---|---|---|---|
| Previous Owner | Mcdaniel Steven | $56,000 | |
| Previous Owner | Vandervort Gaye A | $45,600 |
Source: Public Records
Tax History Compared to Growth
Tax History
| Year | Tax Paid | Tax Assessment Tax Assessment Total Assessment is a certain percentage of the fair market value that is determined by local assessors to be the total taxable value of land and additions on the property. | Land | Improvement |
|---|---|---|---|---|
| 2025 | $922 | $95,167 | $22,980 | $127,130 |
| 2023 | $922 | $144,350 | $21,450 | $122,900 |
| 2022 | $3,286 | $119,810 | $21,450 | $98,360 |
| 2021 | $3,285 | $113,780 | $22,520 | $91,260 |
| 2020 | $3,152 | $107,680 | $19,300 | $88,380 |
| 2019 | $3,063 | $101,970 | $16,080 | $85,890 |
| 2018 | $2,572 | $85,470 | $16,080 | $69,390 |
| 2017 | $2,532 | $83,080 | $16,080 | $67,000 |
| 2016 | $2,428 | $79,680 | $13,400 | $66,280 |
| 2014 | $2,109 | $67,840 | $11,170 | $56,670 |
Source: Public Records
Map
Nearby Homes
- 705 W Coombs St
- 710 S Jackson St
- 1012 S Lee St
- 1020 S Booth Ln
- 914 S Hill St
- 816 W Adoue St
- 403 S Hill St Unit L
- 2710 Hackberry Run
- 1216 S Hill St
- 303 S Jackson St
- 115 W Cleveland St
- 417 W Blum St
- 918 W Lang St
- 4602 Cottonwood Run
- 711 W Sidnor St
- 412 W Sidnor St
- 209 E Foley St
- 405 W Lang St
- 2195 W Lang St
- 222 E Southland Ave
- 606 W Dumble St
- 801 S Jackson St
- 605 W Coombs St
- 702 W Dumble St
- 602 W Dumble St
- 701 W Coombs St
- 703 W Dumble St
- 710 W Foley St
- 601 W Coombs St
- 715 W Dumble St
- 611 W Dumble St
- 707 W Coombs St
- 704 W Foley St
- 723 W Dumble St
- 714 W Foley St
- 711 W Coombs St
- 718 W Foley St
- 725 W Dumble St
- 510 W Dumble St
- 511 W Coombs St