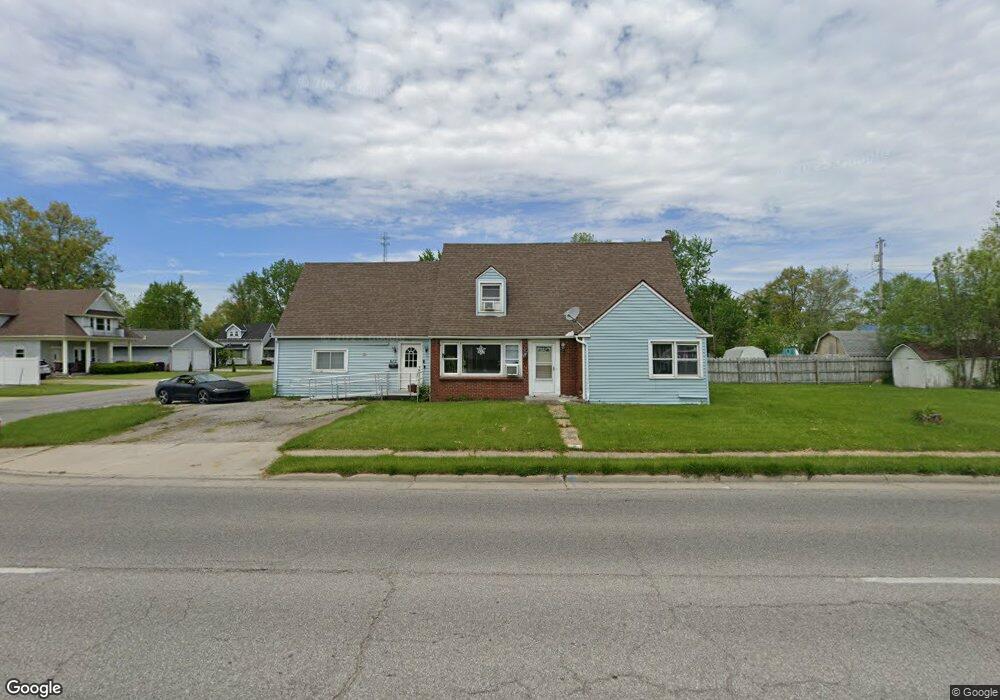
610 W Session St Defiance, OH 43512
Estimated Value: $149,204 - $196,000
4
Beds
2
Baths
1,691
Sq Ft
$97/Sq Ft
Est. Value
About This Home
This home is located at 610 W Session St, Defiance, OH 43512 and is currently estimated at $164,301, approximately $97 per square foot. 610 W Session St is a home located in Defiance County with nearby schools including Defiance Elementary School, Defiance Middle School, and Defiance High School.
Ownership History
Date
Name
Owned For
Owner Type
Purchase Details
Closed on
Aug 29, 2016
Sold by
Djz Properties Llc
Bought by
Mays Dustin W
Current Estimated Value
Home Financials for this Owner
Home Financials are based on the most recent Mortgage that was taken out on this home.
Original Mortgage
$79,900
Outstanding Balance
$62,817
Interest Rate
3.45%
Mortgage Type
VA
Estimated Equity
$101,484
Purchase Details
Closed on
Sep 10, 2015
Sold by
Saylor David Z and Saylor Jackie L
Bought by
Djz Properties Llc
Purchase Details
Closed on
May 18, 2015
Sold by
Unknown
Bought by
Unknown
Purchase Details
Closed on
Jun 5, 2003
Bought by
Djz Properties Llc
Purchase Details
Closed on
Oct 5, 2000
Bought by
Djz Properties Llc
Purchase Details
Closed on
Apr 13, 1995
Bought by
Djz Properties Llc
Create a Home Valuation Report for This Property
The Home Valuation Report is an in-depth analysis detailing your home's value as well as a comparison with similar homes in the area
Home Values in the Area
Average Home Value in this Area
Purchase History
| Date | Buyer | Sale Price | Title Company |
|---|---|---|---|
| Mays Dustin W | $79,900 | None Available | |
| Djz Properties Llc | -- | None Available | |
| Unknown | $29,500 | None Available | |
| Djz Properties Llc | $66,500 | -- | |
| Djz Properties Llc | $70,000 | -- | |
| Djz Properties Llc | $60,900 | -- |
Source: Public Records
Mortgage History
| Date | Status | Borrower | Loan Amount |
|---|---|---|---|
| Open | Mays Dustin W | $79,900 |
Source: Public Records
Tax History
| Year | Tax Paid | Tax Assessment Tax Assessment Total Assessment is a certain percentage of the fair market value that is determined by local assessors to be the total taxable value of land and additions on the property. | Land | Improvement |
|---|---|---|---|---|
| 2025 | $1,543 | $39,480 | $3,450 | $36,030 |
| 2024 | $1,543 | $39,480 | $3,450 | $36,030 |
| 2023 | $1,521 | $39,480 | $3,450 | $36,030 |
| 2022 | $1,413 | $32,790 | $3,370 | $29,420 |
| 2021 | $1,413 | $32,790 | $3,370 | $29,420 |
| 2020 | $1,425 | $32,790 | $3,370 | $29,420 |
| 2019 | $1,449 | $31,240 | $3,370 | $27,870 |
| 2018 | $1,350 | $31,240 | $3,370 | $27,870 |
| 2017 | $1,221 | $31,245 | $3,374 | $27,871 |
| 2016 | $1,144 | $26,030 | $3,374 | $22,656 |
| 2015 | $546 | $25,869 | $3,374 | $22,495 |
| 2014 | $546 | $25,774 | $3,374 | $22,400 |
| 2013 | $546 | $25,774 | $3,374 | $22,400 |
| 2012 | $546 | $25,774 | $3,374 | $22,400 |
Source: Public Records
Map
Nearby Homes
Your Personal Tour Guide
Ask me questions while you tour the home.