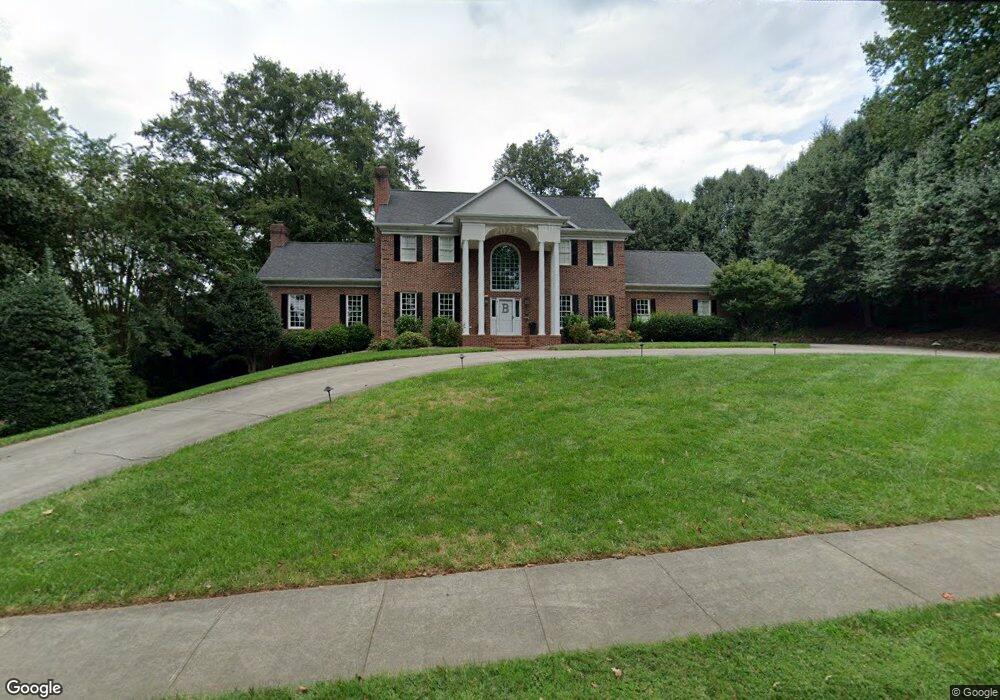
610 W Union St Morganton, NC 28655
Estimated Value: $729,000 - $924,000
3
Beds
4
Baths
4,654
Sq Ft
$172/Sq Ft
Est. Value
About This Home
This home is located at 610 W Union St, Morganton, NC 28655 and is currently estimated at $801,526, approximately $172 per square foot. 610 W Union St is a home located in Burke County with nearby schools including Forest Hill Elementary School, Walter R. Johnson Middle School, and Robert L. Patton High School.
Ownership History
Date
Name
Owned For
Owner Type
Purchase Details
Closed on
Jan 15, 2018
Sold by
Marino James T and Marino Tracie R
Bought by
Bock Duane Philip and Bock Geraldine Lockee
Current Estimated Value
Home Financials for this Owner
Home Financials are based on the most recent Mortgage that was taken out on this home.
Original Mortgage
$388,000
Outstanding Balance
$327,342
Interest Rate
3.93%
Mortgage Type
New Conventional
Estimated Equity
$474,184
Purchase Details
Closed on
Jul 31, 2012
Sold by
Breeden Richard T and Breeden Kathy D
Bought by
Marino James T and Marino Tracie R
Home Financials for this Owner
Home Financials are based on the most recent Mortgage that was taken out on this home.
Original Mortgage
$542,500
Interest Rate
3.68%
Mortgage Type
New Conventional
Create a Home Valuation Report for This Property
The Home Valuation Report is an in-depth analysis detailing your home's value as well as a comparison with similar homes in the area
Home Values in the Area
Average Home Value in this Area
Purchase History
| Date | Buyer | Sale Price | Title Company |
|---|---|---|---|
| Bock Duane Philip | $485,000 | None Available | |
| Marino James T | $542,500 | None Available |
Source: Public Records
Mortgage History
| Date | Status | Borrower | Loan Amount |
|---|---|---|---|
| Open | Bock Duane Philip | $388,000 | |
| Previous Owner | Marino James T | $542,500 |
Source: Public Records
Tax History Compared to Growth
Tax History
| Year | Tax Paid | Tax Assessment Tax Assessment Total Assessment is a certain percentage of the fair market value that is determined by local assessors to be the total taxable value of land and additions on the property. | Land | Improvement |
|---|---|---|---|---|
| 2025 | $3,509 | $614,766 | $66,371 | $548,395 |
| 2024 | $3,536 | $614,766 | $66,371 | $548,395 |
| 2023 | $3,531 | $614,766 | $66,371 | $548,395 |
| 2022 | $3,818 | $537,501 | $151,371 | $386,130 |
| 2021 | $3,812 | $537,501 | $151,371 | $386,130 |
| 2020 | $3,808 | $537,501 | $151,371 | $386,130 |
| 2019 | $3,808 | $537,501 | $151,371 | $386,130 |
| 2018 | $3,492 | $492,053 | $151,371 | $340,682 |
| 2017 | $3,490 | $492,053 | $151,371 | $340,682 |
| 2016 | $3,406 | $491,314 | $151,371 | $339,943 |
| 2015 | $3,403 | $491,314 | $151,371 | $339,943 |
| 2014 | $3,402 | $491,314 | $151,371 | $339,943 |
| 2013 | $3,402 | $491,314 | $151,371 | $339,943 |
Source: Public Records
Map
Nearby Homes
- 300 Patton St
- 212 Riverside Dr
- 107 Burkemont Ave
- 404 Patton St
- 115 Riverside Ct
- 113 Falls St
- 218 Davis Dr
- 213 W Park Dr
- 244 N Anderson St
- 00 S Anderson St
- 231 Davis Dr
- 220 W Park Dr
- 406 Burkemont Ave
- 311 W Union St
- 410 Burkemont Ave Unit A-D
- 223 W Park Dr
- 115 Kinwood St
- 107 Rhyne St
- 214 Howard St
- 118 W Union St Unit A
- 608 W Union St
- 100 Hillside Ln
- 107 Steeple Heights Ln
- 102 Hillside Ln
- 102 Hillside Ln Unit 21/22
- 611 W Union St
- 613 W Union St
- 105 Mountain View St
- 609 W Union St
- 615 W Union St
- 604 W Union St
- 604 W Union St
- 103 Hillside Ln
- 110 Mountain View St
- 607 W Union St
- 617 W Union St
- 101 Montrose St
- 106 Mimosa St
- 106 Mimosa St
- 313 W Union St