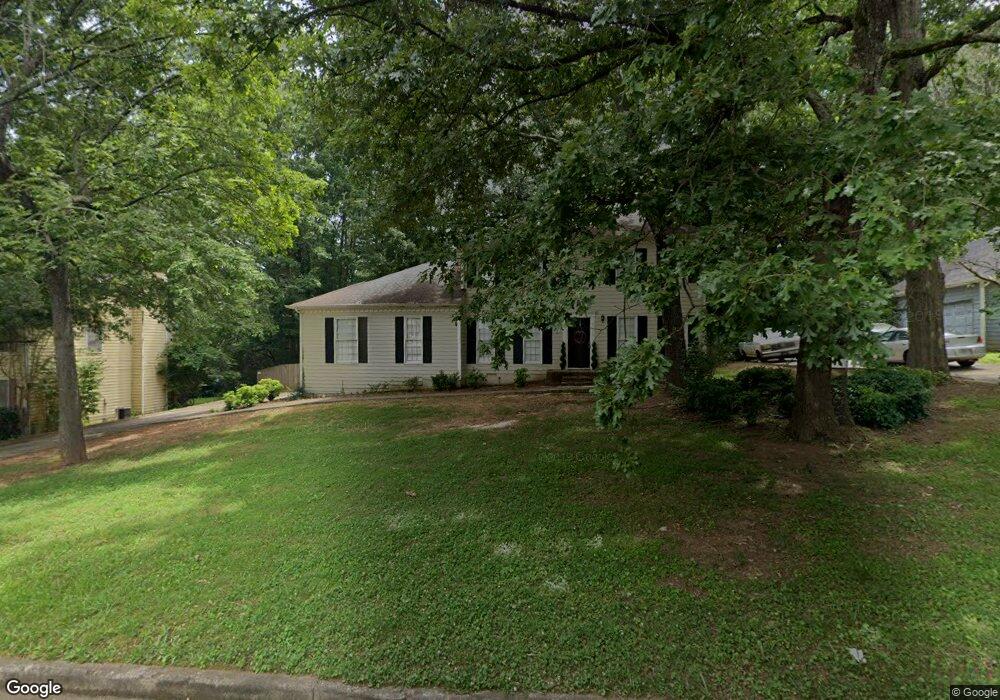
610 Wellington Way Unit 6 Jonesboro, GA 30238
Estimated Value: $236,174 - $270,000
3
Beds
3
Baths
1,898
Sq Ft
$132/Sq Ft
Est. Value
About This Home
This home is located at 610 Wellington Way Unit 6, Jonesboro, GA 30238 and is currently estimated at $250,294, approximately $131 per square foot. 610 Wellington Way Unit 6 is a home located in Clayton County with nearby schools including Swint Elementary School, Pointe South Middle School, and Mundy's Mill High School.
Ownership History
Date
Name
Owned For
Owner Type
Purchase Details
Closed on
Jun 8, 2017
Bought by
Project Promise Atlanta Llc
Current Estimated Value
Purchase Details
Closed on
Nov 12, 2014
Sold by
Thr Georgia Lp
Bought by
2014 3 Ih Borrower Lp
Purchase Details
Closed on
Sep 4, 2012
Sold by
Chappell Willie
Bought by
Thr Georgia Llc
Purchase Details
Closed on
Jan 20, 2005
Sold by
Chappell Willie C
Bought by
Chappell Willie and Chappell Andrea
Home Financials for this Owner
Home Financials are based on the most recent Mortgage that was taken out on this home.
Original Mortgage
$147,000
Interest Rate
7.88%
Mortgage Type
New Conventional
Purchase Details
Closed on
Aug 20, 1997
Sold by
Barnhart Randal A and Barnhart Wendy W
Bought by
Chappell Willie C and Watson Angela D
Home Financials for this Owner
Home Financials are based on the most recent Mortgage that was taken out on this home.
Original Mortgage
$101,329
Interest Rate
7.43%
Mortgage Type
FHA
Create a Home Valuation Report for This Property
The Home Valuation Report is an in-depth analysis detailing your home's value as well as a comparison with similar homes in the area
Home Values in the Area
Average Home Value in this Area
Purchase History
| Date | Buyer | Sale Price | Title Company |
|---|---|---|---|
| Project Promise Atlanta Llc | $500,060 | -- | |
| 2014 3 Ih Borrower Lp | -- | -- | |
| Thr Georgia Llc | $36,600 | -- | |
| Chappell Willie | -- | -- | |
| Chappell Willie C | $102,900 | -- |
Source: Public Records
Mortgage History
| Date | Status | Borrower | Loan Amount |
|---|---|---|---|
| Previous Owner | Chappell Willie | $147,000 | |
| Previous Owner | Chappell Willie C | $101,329 |
Source: Public Records
Tax History Compared to Growth
Tax History
| Year | Tax Paid | Tax Assessment Tax Assessment Total Assessment is a certain percentage of the fair market value that is determined by local assessors to be the total taxable value of land and additions on the property. | Land | Improvement |
|---|---|---|---|---|
| 2024 | $3,202 | $82,080 | $8,000 | $74,080 |
| 2023 | $2,847 | $78,840 | $8,000 | $70,840 |
| 2022 | $2,460 | $62,680 | $8,000 | $54,680 |
| 2021 | $2,109 | $53,400 | $8,000 | $45,400 |
| 2020 | $1,967 | $49,172 | $8,000 | $41,172 |
| 2019 | $1,866 | $45,975 | $5,600 | $40,375 |
| 2018 | $1,638 | $40,341 | $5,327 | $35,014 |
| 2017 | $1,578 | $38,781 | $5,600 | $33,181 |
| 2016 | $1,417 | $34,824 | $5,600 | $29,224 |
| 2015 | $1,374 | $0 | $0 | $0 |
| 2014 | $897 | $26,540 | $5,600 | $20,940 |
Source: Public Records
Map
Nearby Homes
- 638 Wellington Way
- 444 Wellington Way
- 578 Wellington Way
- 553 Wellington Way
- 8654 Webb Rd
- 8652 Webb Rd
- 714 Chatham Trail
- 8650 Webb Rd
- 8646 Webb Rd
- 8644 Webb Rd
- 8640 Webb Rd
- 8638 Webb Rd
- 529 Westminster Ln
- 8632 Webb Rd
- 8626 Webb Rd
- 8624 Webb Rd
- 8614 Webb Rd
- 616 Country Lane Dr
- 8865 Raven Dr
- 778 Villa Way
- 620 Wellington Way Unit 6
- 600 Wellington Way Unit 6
- 613 Chatham Trail
- 603 Chatham Trail
- 603 Chaham Trail Unit 603
- 628 Wellington Way
- 590 Wellington Way
- 623 Chatham Trail
- 623 Chatham Trail Unit 5
- 589 Chatham Trail
- 615 Wellington Way
- 605 Wellington Way
- 597 Wellington Way
- 625 Wellington Way
- 629 Chatham Trail Unit 1
- 587 Wellington Way Unit 6
- 583 Chatham Trail Unit 5
- 633 Wellington Way
- 606 Chatham Trail
- 618 Chatham Trail