A
Seller's Agent in 2014
Allan Willcox
Willcox Realty Company
(229) 886-2828
53 Total Sales
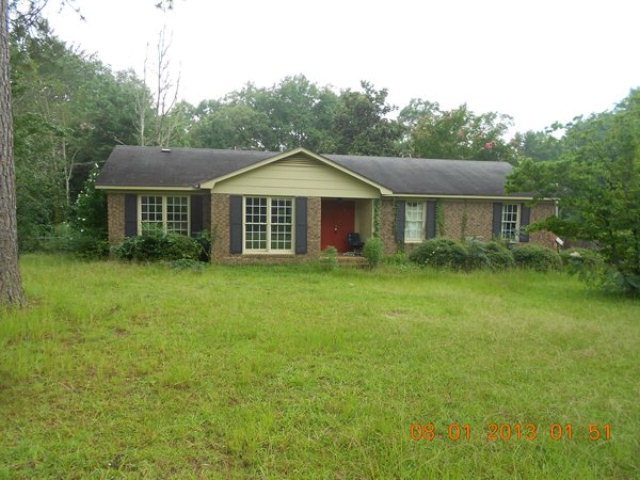
Estimated Value: $133,959 - $158,000
NEW PAINT, NEW CENTRAL HEAT AND AIR UNIT, SOLD AS IS 3 BEDROOM 2 BATH , 1788 SQUARE FEET, INGROUND POOL
Last Agent to Sell the Property
Willcox Realty Company Brokerage Phone: 2294351717 License #201128 Listed on: 03/10/2014
Last Buyer's Agent
Willcox Realty Company Brokerage Phone: 2294351717 License #201128 Listed on: 03/10/2014
| Date | Buyer | Sale Price | Title Company |
|---|---|---|---|
| Aaron Development Llc | $34,312 | -- | |
| Federal Home Loan Mortgage Corporation | $85,000 | -- | |
| Branch Banking & Trust Co | $85,000 | -- | |
| Brusnwick Randy S | $85,000 | -- | |
| Hall Gerald R | -- | -- | |
| Hall Gerald | -- | -- |
| Date | Event | Price | List to Sale | Price per Sq Ft |
|---|---|---|---|---|
| 04/11/2014 04/11/14 | Sold | $35,000 | -- | $20 / Sq Ft |
| 03/10/2014 03/10/14 | Pending | -- | -- | -- |
| Year | Tax Paid | Tax Assessment Tax Assessment Total Assessment is a certain percentage of the fair market value that is determined by local assessors to be the total taxable value of land and additions on the property. | Land | Improvement |
|---|---|---|---|---|
| 2024 | $1,164 | $25,200 | $5,320 | $19,880 |
| 2023 | $1,165 | $25,200 | $5,320 | $19,880 |
| 2022 | $1,168 | $25,200 | $5,320 | $19,880 |
| 2021 | $1,081 | $25,200 | $5,320 | $19,880 |
| 2020 | $1,083 | $25,200 | $5,320 | $19,880 |
| 2019 | $1,085 | $25,200 | $5,320 | $19,880 |
| 2018 | $1,088 | $25,200 | $5,320 | $19,880 |
| 2017 | $1,012 | $25,200 | $5,320 | $19,880 |
| 2016 | $1,230 | $25,200 | $5,320 | $19,880 |
| 2015 | $553 | $13,725 | $5,320 | $8,405 |
| 2014 | $545 | $13,725 | $5,320 | $8,405 |
A
Seller's Agent in 2014
Allan Willcox
Willcox Realty Company
(229) 886-2828
53 Total Sales
Source: Albany Board of REALTORS®
MLS Number: 130195
APN: 00111-00002-019
