6100 Penny Pike Springfield, OH 45502
2
Beds
1
Bath
1,521
Sq Ft
5.33
Acres
About This Home
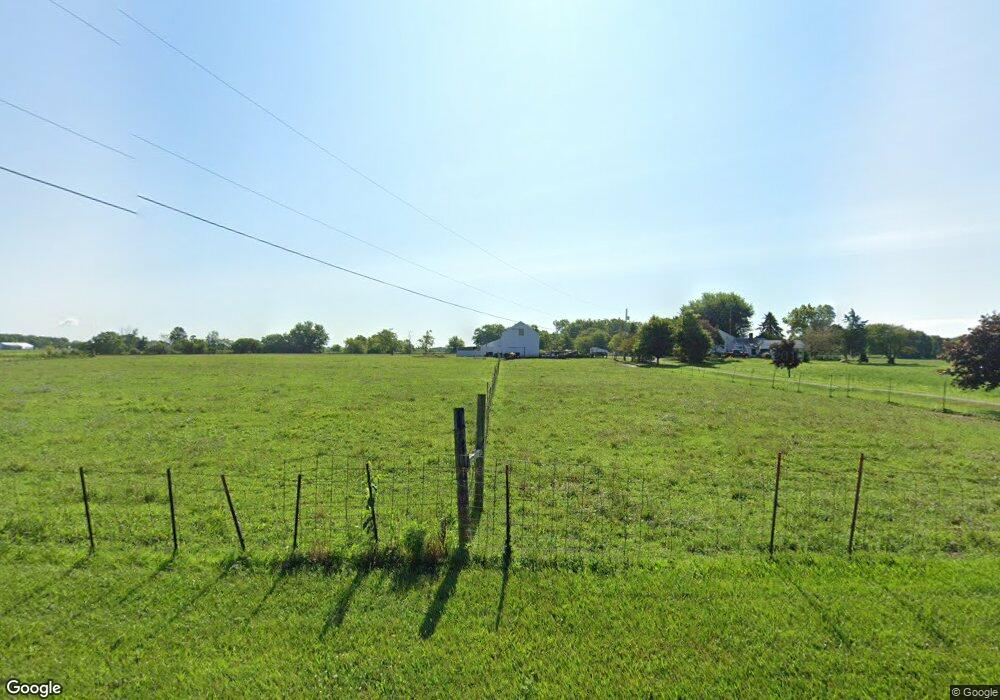
This home is located at 6100 Penny Pike, Springfield, OH 45502. 6100 Penny Pike is a home located in Clark County with nearby schools including Northwestern Elementary School and Northwestern Junior/Senior High School.
Create a Home Valuation Report for This Property
The Home Valuation Report is an in-depth analysis detailing your home's value as well as a comparison with similar homes in the area
Tax History Compared to Growth
Tax History
| Year | Tax Paid | Tax Assessment Tax Assessment Total Assessment is a certain percentage of the fair market value that is determined by local assessors to be the total taxable value of land and additions on the property. | Land | Improvement |
|---|---|---|---|---|
| 2025 | $1,865 | $89,400 | $50,200 | $39,200 |
| 2024 | $1,865 | $44,380 | $19,720 | $24,660 |
| 2023 | $1,865 | $44,380 | $19,720 | $24,660 |
| 2022 | $1,462 | $44,380 | $19,720 | $24,660 |
| 2021 | $1,228 | $35,160 | $15,280 | $19,880 |
| 2020 | $1,241 | $35,160 | $15,280 | $19,880 |
| 2019 | $1,229 | $35,160 | $15,280 | $19,880 |
| 2018 | $1,164 | $31,990 | $14,120 | $17,870 |
| 2017 | $1,165 | $31,998 | $14,123 | $17,875 |
| 2016 | $1,142 | $31,998 | $14,123 | $17,875 |
| 2015 | $1,558 | $31,294 | $13,699 | $17,595 |
| 2014 | $1,557 | $31,294 | $13,699 | $17,595 |
| 2013 | $1,546 | $31,294 | $13,699 | $17,595 |
Source: Public Records
Map
Nearby Homes
- 6568 Dialton Rd
- 6258 Zachary Ave
- 5411 Terre Haute Rd
- 5889 Troy Rd
- 3961 Shrine Rd
- 0 St Rt 55 Unit 25869228
- 6250 Willowdale Rd
- 81 W Clark St
- 6580 Shaler Dr
- 5886 State Route 55
- 5770 Storms Creek Rd
- 268 Hampton Trail
- 286 Hampton Trail
- 4444 Willowdale Rd
- 3172 Folk Ream Rd
- 3771 Spence Rd
- 3000-3002 Shrine Rd
- 00 Folk Ream Rd
- 1 Folk Ream Rd
- 4211 Grey Stone Crossing
- 6200 Penny Pike
- 6230 Penny Pike
- 6165 Penny Pike
- 6125 Penny Pike
- 6201 Penny Pike
- 6250 Penny Pike
- 6239 Penny Pike
- 6270 Penny Pike
- 6259 Penny Pike
- 6323 Penny Pike
- 6425 Penny Pike
- 6455 Penny Pike
- 6175 Ballentine Pike
- 6485 Penny Pike
- 6161 Ballentine Pike
- 6115 Ballentine Pike
- 6259 Ballentine Pike
- 6295 Ballentine Pike
- 6230 Ballentine Pike
- 6127 Ballentine Pike