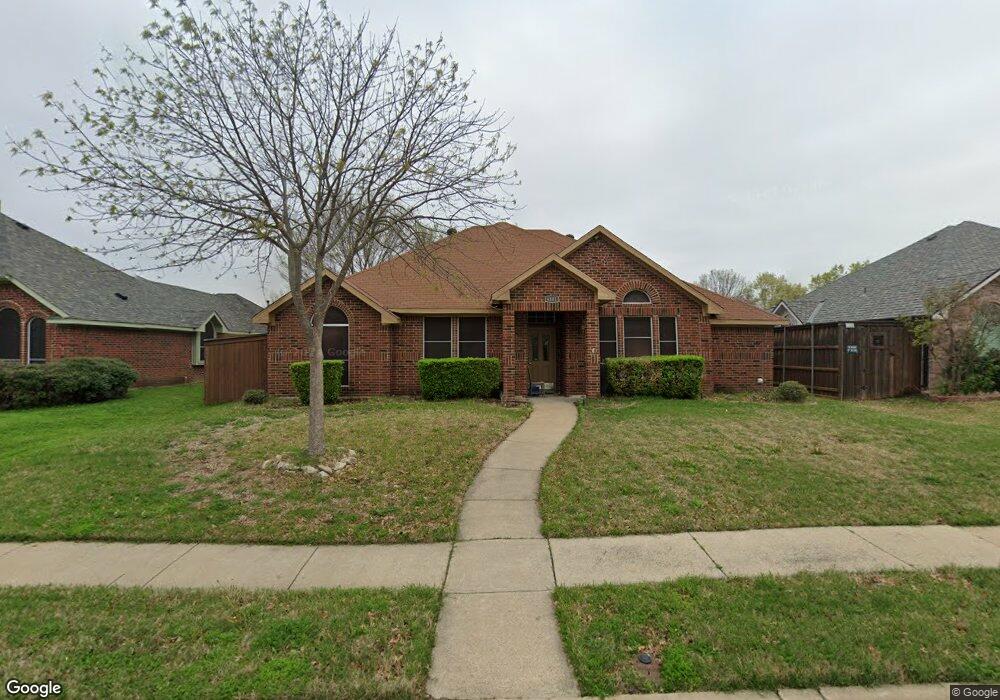
6101 Faringdon Ln Rowlett, TX 75089
Springfield NeighborhoodEstimated Value: $342,341 - $400,000
3
Beds
2
Baths
1,761
Sq Ft
$207/Sq Ft
Est. Value
About This Home
This home is located at 6101 Faringdon Ln, Rowlett, TX 75089 and is currently estimated at $363,835, approximately $206 per square foot. 6101 Faringdon Ln is a home located in Dallas County with nearby schools including Harmony Science Academy - Garland, Harmony School of Innovation - Garland, and Wesleyan Christian Academy.
Ownership History
Date
Name
Owned For
Owner Type
Purchase Details
Closed on
Dec 28, 2016
Sold by
Robinson Mark K and Robinson Christin
Bought by
Castillo Jesse and Mejia Lidia
Current Estimated Value
Home Financials for this Owner
Home Financials are based on the most recent Mortgage that was taken out on this home.
Original Mortgage
$224,852
Outstanding Balance
$185,982
Interest Rate
4.25%
Mortgage Type
FHA
Estimated Equity
$177,853
Purchase Details
Closed on
May 28, 1998
Sold by
Wettey Mac E
Bought by
Robinson Mark A and Robinson Christin
Home Financials for this Owner
Home Financials are based on the most recent Mortgage that was taken out on this home.
Original Mortgage
$106,400
Interest Rate
7.2%
Purchase Details
Closed on
Jul 9, 1997
Sold by
Jones Kelly W and Jones Michelle A
Bought by
Wettey Mac E
Home Financials for this Owner
Home Financials are based on the most recent Mortgage that was taken out on this home.
Original Mortgage
$103,937
Interest Rate
7.85%
Mortgage Type
FHA
Create a Home Valuation Report for This Property
The Home Valuation Report is an in-depth analysis detailing your home's value as well as a comparison with similar homes in the area
Home Values in the Area
Average Home Value in this Area
Purchase History
| Date | Buyer | Sale Price | Title Company |
|---|---|---|---|
| Castillo Jesse | -- | None Available | |
| Robinson Mark A | -- | -- | |
| Wettey Mac E | -- | -- |
Source: Public Records
Mortgage History
| Date | Status | Borrower | Loan Amount |
|---|---|---|---|
| Open | Castillo Jesse | $224,852 | |
| Previous Owner | Robinson Mark A | $106,400 | |
| Previous Owner | Wettey Mac E | $103,937 |
Source: Public Records
Tax History Compared to Growth
Tax History
| Year | Tax Paid | Tax Assessment Tax Assessment Total Assessment is a certain percentage of the fair market value that is determined by local assessors to be the total taxable value of land and additions on the property. | Land | Improvement |
|---|---|---|---|---|
| 2025 | $6,173 | $351,010 | $70,000 | $281,010 |
| 2024 | $6,173 | $351,010 | $70,000 | $281,010 |
| 2023 | $6,173 | $326,830 | $70,000 | $256,830 |
| 2022 | $7,920 | $326,830 | $70,000 | $256,830 |
| 2021 | $6,356 | $242,820 | $55,000 | $187,820 |
| 2020 | $6,413 | $242,820 | $55,000 | $187,820 |
| 2019 | $6,978 | $242,820 | $55,000 | $187,820 |
| 2018 | $6,784 | $234,410 | $30,000 | $204,410 |
| 2017 | $6,802 | $234,410 | $30,000 | $204,410 |
| 2016 | $4,508 | $155,360 | $30,000 | $125,360 |
| 2015 | $3,568 | $131,920 | $26,000 | $105,920 |
| 2014 | $3,568 | $131,920 | $26,000 | $105,920 |
Source: Public Records
Map
Nearby Homes
- 6718 Livingstone St
- 6317 Locust St
- 6617 Stamps St
- 6306 Debbie Cir
- 6407 Redwood Ln
- 2221 Petunia Ln
- 6110 Tacoma St
- 6913 Brandford Rd
- 7005 Buckhorn Dr
- 7013 Tremont Ln
- 2601 Daisy Ln
- 2314 Marigold Dr
- 5905 Cedar Ln
- 3422 Jonquil Ln
- 2001 Maggis Meadow Ln
- 3510 Jonquil Ln
- 5516 Maple Ln
- 5909 Brookline Dr
- 1501 Patty Cir
- 1709 Northampton Dr
- 6105 Faringdon Ln
- 6017 Faringdon Ln
- 6018 Hawkeye Rd
- 6109 Faringdon Ln
- 6102 Hawkeye Rd
- 6014 Hawkeye Rd
- 6018 Faringdon Ln
- 6102 Faringdon Ln
- 6106 Hawkeye Rd
- 6014 Faringdon Ln
- 6113 Faringdon Ln
- 6106 Faringdon Ln
- 6509 Springmeadow Ln
- 6110 Hawkeye Rd
- 6501 Springmeadow Ln
- 6513 Springmeadow Ln
- 6417 Springmeadow Ln
- 6117 Faringdon Ln
- 6517 Springmeadow Ln
- 6017 Hawkeye Rd