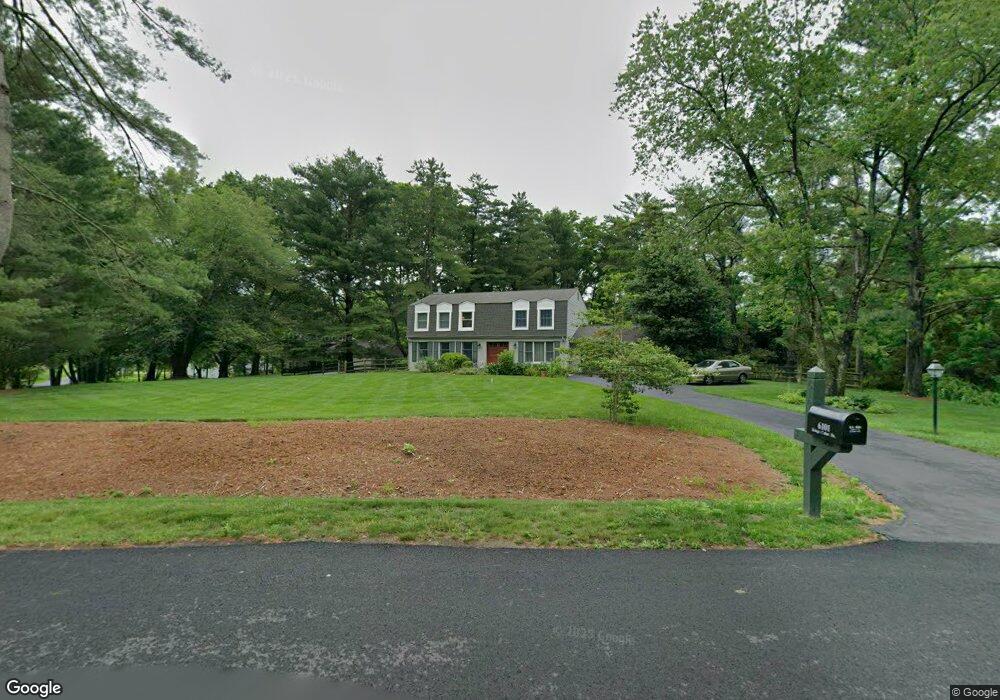
6101 Kings Color Dr Fairfax, VA 22030
Estimated Value: $939,000 - $1,120,000
4
Beds
3
Baths
2,602
Sq Ft
$391/Sq Ft
Est. Value
About This Home
This home is located at 6101 Kings Color Dr, Fairfax, VA 22030 and is currently estimated at $1,017,946, approximately $391 per square foot. 6101 Kings Color Dr is a home located in Fairfax County with nearby schools including Oak View Elementary School, James W Robinson, Jr. Secondary School, and Little Flock Christian School.
Ownership History
Date
Name
Owned For
Owner Type
Purchase Details
Closed on
Dec 14, 2020
Sold by
Roman Mark S and Roman Alisa M
Bought by
Roman Mark S and Roman Alisa M
Current Estimated Value
Home Financials for this Owner
Home Financials are based on the most recent Mortgage that was taken out on this home.
Original Mortgage
$460,000
Outstanding Balance
$409,145
Interest Rate
2.9%
Mortgage Type
VA
Estimated Equity
$608,801
Purchase Details
Closed on
Oct 22, 2020
Sold by
Roman Mark S and Roman Alisa M
Bought by
Roman Mark S and Roman Alisa M
Home Financials for this Owner
Home Financials are based on the most recent Mortgage that was taken out on this home.
Original Mortgage
$460,000
Outstanding Balance
$409,145
Interest Rate
2.9%
Mortgage Type
VA
Estimated Equity
$608,801
Purchase Details
Closed on
Apr 6, 2020
Sold by
Roman Mark and Roman Alisa
Bought by
Roman Mark S and Roman Alisa M
Purchase Details
Closed on
Jun 4, 1999
Sold by
Jackson Michael J
Bought by
Roman Mark
Home Financials for this Owner
Home Financials are based on the most recent Mortgage that was taken out on this home.
Original Mortgage
$240,000
Interest Rate
6.85%
Create a Home Valuation Report for This Property
The Home Valuation Report is an in-depth analysis detailing your home's value as well as a comparison with similar homes in the area
Home Values in the Area
Average Home Value in this Area
Purchase History
| Date | Buyer | Sale Price | Title Company |
|---|---|---|---|
| Roman Mark S | -- | None Available | |
| Roman Mark S | -- | None Available | |
| Roman Mark S | -- | None Available | |
| Roman Mark S | -- | Non Available | |
| Roman Mark | $325,000 | -- |
Source: Public Records
Mortgage History
| Date | Status | Borrower | Loan Amount |
|---|---|---|---|
| Open | Roman Mark S | $460,000 | |
| Closed | Roman Mark | $240,000 |
Source: Public Records
Tax History Compared to Growth
Tax History
| Year | Tax Paid | Tax Assessment Tax Assessment Total Assessment is a certain percentage of the fair market value that is determined by local assessors to be the total taxable value of land and additions on the property. | Land | Improvement |
|---|---|---|---|---|
| 2025 | $9,389 | $877,690 | $335,000 | $542,690 |
| 2024 | $9,389 | $810,420 | $325,000 | $485,420 |
| 2023 | $9,146 | $810,420 | $325,000 | $485,420 |
| 2022 | $9,267 | $810,420 | $325,000 | $485,420 |
| 2021 | $7,613 | $648,740 | $275,000 | $373,740 |
| 2020 | $7,678 | $648,740 | $275,000 | $373,740 |
| 2019 | $7,877 | $665,560 | $275,000 | $390,560 |
| 2018 | $7,055 | $613,490 | $230,000 | $383,490 |
| 2017 | $7,388 | $636,370 | $230,000 | $406,370 |
| 2016 | $6,977 | $602,250 | $220,000 | $382,250 |
| 2015 | $6,721 | $602,250 | $220,000 | $382,250 |
| 2014 | $6,473 | $581,290 | $215,000 | $366,290 |
Source: Public Records
Map
Nearby Homes
- 6102 Kings Color Dr
- 6116 Kings Color Dr
- 12133 Queens Brigade Dr
- 5800 Fox Chapel Estates Dr
- 12517 Easter Ln
- 5726 Walcott Ave
- 11533 Clara Barton Dr
- 12511 Rochester Dr
- 6812 Glencove Dr
- 11433 Popes Head Rd
- 5308 Hexagon Place
- 5305 Hexagon Place
- 12609 Braddock Rd
- 6830 Clifton Rd
- 5129 First Rd
- 11123 Popes Head Rd
- 13005 Compton Rd
- 6705 Cedar View Ct
- 5826 Hannora Ln
- 12848 Redbird Ridge
- 12103 Gary Hill Dr
- 12107 Gary Hill Dr
- 12101 Gary Hill Dr
- 12104 Gary Hill Dr
- 12106 Gary Hill Dr
- 6022 Crupper Place
- 12109 Gary Hill Dr
- 6113 Saddle Horn Dr
- 6104 Kings Color Dr
- 6106 Kings Color Dr
- 6107 Kings Color Dr
- 6020 Crupper Place
- 12019 Gary Hill Dr
- 6117 Saddle Horn Dr
- 6023 Crupper Place
- 12154 Queens Brigade Dr
- 6111 Saddle Horn Dr
- 12172 Queens Brigade Dr
- 12160 Queens Brigade Dr
- 6100 Queens Brigade Ct