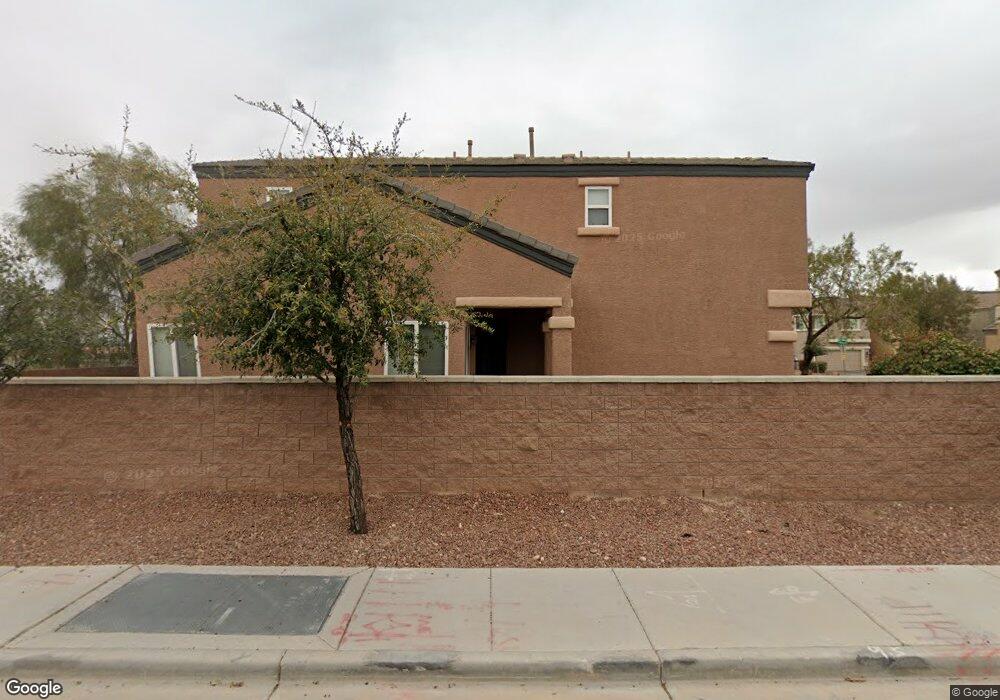
6102 Forever Dawn St Las Vegas, NV 89148
Estimated Value: $390,000 - $395,000
2
Beds
3
Baths
1,319
Sq Ft
$298/Sq Ft
Est. Value
About This Home
This home is located at 6102 Forever Dawn St, Las Vegas, NV 89148 and is currently estimated at $393,190, approximately $298 per square foot. 6102 Forever Dawn St is a home located in Clark County with nearby schools including Shelley Berkley Elementary School, Wilbur & Theresa Faiss Middle School, and Sierra Vista High School.
Ownership History
Date
Name
Owned For
Owner Type
Purchase Details
Closed on
Jan 21, 2009
Sold by
The Bank Of New York
Bought by
Orpel James Richard
Current Estimated Value
Home Financials for this Owner
Home Financials are based on the most recent Mortgage that was taken out on this home.
Original Mortgage
$122,100
Outstanding Balance
$76,058
Interest Rate
4.91%
Mortgage Type
FHA
Estimated Equity
$317,132
Purchase Details
Closed on
Sep 19, 2008
Sold by
Mezger Andrew
Bought by
The Bank Of New York
Purchase Details
Closed on
Jan 13, 2006
Sold by
Distinctive Homes At The Springs Ii Llc
Bought by
Mezger Andrew
Home Financials for this Owner
Home Financials are based on the most recent Mortgage that was taken out on this home.
Original Mortgage
$231,350
Interest Rate
6.28%
Mortgage Type
Fannie Mae Freddie Mac
Create a Home Valuation Report for This Property
The Home Valuation Report is an in-depth analysis detailing your home's value as well as a comparison with similar homes in the area
Home Values in the Area
Average Home Value in this Area
Purchase History
| Date | Buyer | Sale Price | Title Company |
|---|---|---|---|
| Orpel James Richard | $140,000 | First American Title Paseo V | |
| The Bank Of New York | $139,400 | First American Title Ins Co | |
| Mezger Andrew | $284,078 | Southwest Title |
Source: Public Records
Mortgage History
| Date | Status | Borrower | Loan Amount |
|---|---|---|---|
| Open | Orpel James Richard | $122,100 | |
| Previous Owner | Mezger Andrew | $231,350 |
Source: Public Records
Tax History Compared to Growth
Tax History
| Year | Tax Paid | Tax Assessment Tax Assessment Total Assessment is a certain percentage of the fair market value that is determined by local assessors to be the total taxable value of land and additions on the property. | Land | Improvement |
|---|---|---|---|---|
| 2025 | $1,516 | $98,093 | $37,450 | $60,643 |
| 2024 | $1,472 | $98,093 | $37,450 | $60,643 |
| 2023 | $1,472 | $89,880 | $32,900 | $56,980 |
| 2022 | $1,567 | $82,804 | $30,800 | $52,004 |
| 2021 | $1,451 | $74,585 | $25,200 | $49,385 |
| 2020 | $1,345 | $73,387 | $24,500 | $48,887 |
| 2019 | $1,260 | $70,417 | $22,400 | $48,017 |
| 2018 | $1,202 | $62,400 | $16,450 | $45,950 |
| 2017 | $1,825 | $62,213 | $15,750 | $46,463 |
| 2016 | $1,126 | $57,957 | $12,250 | $45,707 |
| 2015 | $1,123 | $54,324 | $8,400 | $45,924 |
| 2014 | $1,089 | $36,005 | $5,950 | $30,055 |
Source: Public Records
Map
Nearby Homes
- 6125 Powdermill St
- 9709 Hawk Cliff Ave
- 6169 Novelty St
- 9628 Scrub Jay Ct
- 6336 Fence Post St
- 9505 Delivery Ave
- 9691 Loud Water Way
- 6234 Burrell Ct
- 10015 Wonderful Day Dr Unit 8
- 9611 Aberdeen Ridge Ct
- 9580 Magnificent Ave
- 10023 Liberty View Rd Unit 8
- 9632 Abbey Pond Ave
- 6228 Windfresh Dr Unit 2
- 10056 Cranbrook Falls Ct
- 10134 Reflection Brook Ave
- 5915 Poplar Tree St Unit 7
- 10127 Clifton Forge Ave
- 9460 Magnificent Ave
- 10105 Prattville Ave Unit 5
- 6106 Forever Dawn St
- 6110 Forever Dawn St
- 9714 Wailings Ave
- 6114 Forever Dawn St
- 9720 Wailings Ave
- 6120 Forever Dawn St
- 6090 Doroca St
- 9715 Wailings Ave
- 9726 Wailings Ave
- 6126 Forever Dawn St Unit 1
- 6095 Doroca St
- 9721 Wailings Ave
- 9732 Wailings Ave
- 6084 Doroca St
- 6132 Forever Dawn St
- 9727 Wailings Ave
- 6089 Doroca St
- 9691 Delivery Ave
- 9738 Wailings Ave
- 6078 Doroca St