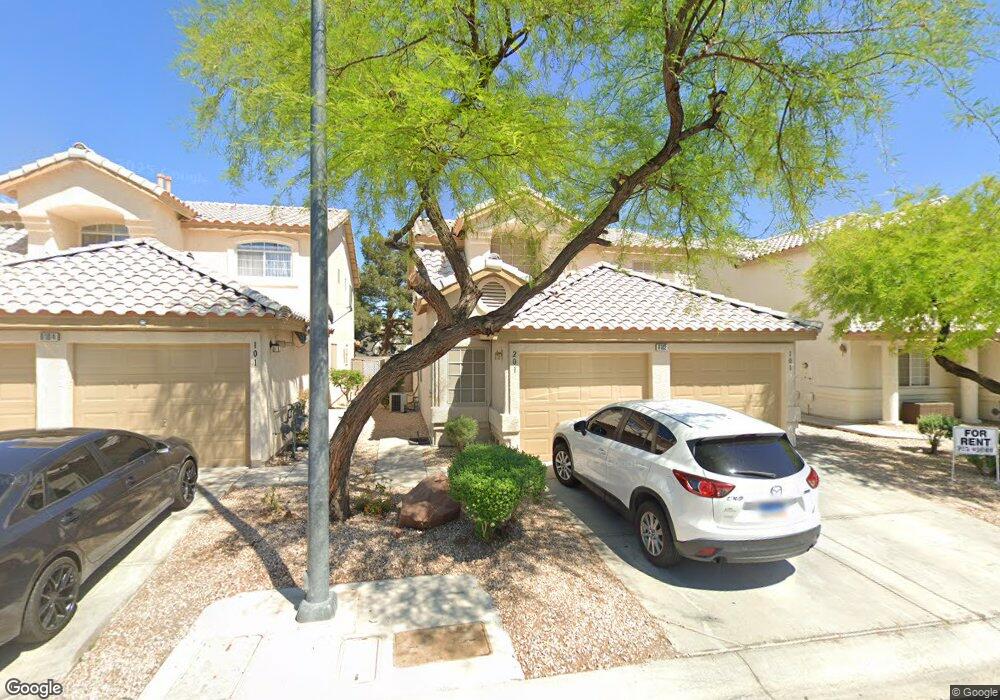
6102 Hilside Blom Ct Unit 101 Las Vegas, NV 89130
Estimated Value: $275,725 - $292,000
3
Beds
2
Baths
1,063
Sq Ft
$269/Sq Ft
Est. Value
About This Home
This home is located at 6102 Hilside Blom Ct Unit 101, Las Vegas, NV 89130 and is currently estimated at $285,431, approximately $268 per square foot. 6102 Hilside Blom Ct Unit 101 is a home located in Clark County with nearby schools including Joseph M Neal Elementary School, Anthony Saville Middle School, and Shadow Ridge High School.
Ownership History
Date
Name
Owned For
Owner Type
Purchase Details
Closed on
Mar 2, 2012
Sold by
Pabon Jeremiah R and Pabon Juan R
Bought by
Pabon J Raymond and The J Raymond Pabon Revocable Trust
Current Estimated Value
Purchase Details
Closed on
Sep 13, 2011
Sold by
The Secretary Of Housing & Urban Develop
Bought by
Pabon Jeremiah R and Pabon Juan R
Purchase Details
Closed on
Mar 31, 2011
Sold by
Chase Home Finance Llc
Bought by
Secretary Of The Department Of Housing &
Purchase Details
Closed on
Mar 22, 2011
Sold by
Goodweiler Michael A and Goodweiler Sharon
Bought by
Chase Home Finance Llc
Purchase Details
Closed on
Aug 11, 1999
Sold by
Bivins Construction Co Inc
Bought by
Goodweiler Michael A and Goodweiler Sharon
Home Financials for this Owner
Home Financials are based on the most recent Mortgage that was taken out on this home.
Original Mortgage
$77,450
Interest Rate
7.7%
Create a Home Valuation Report for This Property
The Home Valuation Report is an in-depth analysis detailing your home's value as well as a comparison with similar homes in the area
Home Values in the Area
Average Home Value in this Area
Purchase History
| Date | Buyer | Sale Price | Title Company |
|---|---|---|---|
| Pabon J Raymond | -- | Accommodation | |
| Pabon Jeremiah R | $40,500 | Nevada Title Las Vegas | |
| Secretary Of The Department Of Housing & | $217,423 | Pasion Title Services | |
| Chase Home Finance Llc | $217,423 | Accommodation | |
| Goodweiler Michael A | $89,500 | Nevada Title Company |
Source: Public Records
Mortgage History
| Date | Status | Borrower | Loan Amount |
|---|---|---|---|
| Previous Owner | Goodweiler Michael A | $77,450 |
Source: Public Records
Tax History Compared to Growth
Tax History
| Year | Tax Paid | Tax Assessment Tax Assessment Total Assessment is a certain percentage of the fair market value that is determined by local assessors to be the total taxable value of land and additions on the property. | Land | Improvement |
|---|---|---|---|---|
| 2025 | $715 | $55,119 | $23,100 | $32,019 |
| 2024 | $694 | $55,119 | $23,100 | $32,019 |
| 2023 | $728 | $55,784 | $26,250 | $29,534 |
| 2022 | $707 | $47,997 | $20,650 | $27,347 |
| 2021 | $684 | $44,998 | $18,550 | $26,448 |
| 2020 | $633 | $45,688 | $19,250 | $26,438 |
| 2019 | $625 | $40,992 | $15,750 | $25,242 |
| 2018 | $596 | $34,103 | $8,750 | $25,353 |
| 2017 | $994 | $30,329 | $7,000 | $23,329 |
| 2016 | $566 | $27,708 | $6,300 | $21,408 |
| 2015 | $565 | $27,596 | $4,200 | $23,396 |
| 2014 | $547 | $16,318 | $4,200 | $12,118 |
Source: Public Records
Map
Nearby Homes
- 6105 Crockery St
- 7513 Hickory Hills Dr
- 7563 Violet Vista Ave Unit 201
- 6013 Pebble Grey Ln
- 7553 Durham Hall Ave Unit 201
- 7553 Durham Hall Ave Unit 101
- 7566 Glowing Ember Ct Unit 101
- 7570 Durham Hall Ave Unit 101
- 7572 Durham Hall Ave Unit 201
- 7321 Jockey Ave
- 6040 N Monte Cristo Way
- 5901 Silver Heights St
- 5732 Desert Sky Way
- 5836 Round Castle St
- 7849 March Brown Ave
- 7804 Wind Drift Rd
- 7844 Quill Gordon Ave
- 5730 Sky Pointe Dr Unit 165
- 5708 Berwick Falls Ln
- 7461 Suzanne Elaine Ct
- 6102 Hillside Bloom Ct Unit summerhills condos
- 6102 Hilside Blom Ct Unit 201
- 6102 Hillside Bloom Ct Unit 101
- 6104 Hilside Blom Ct Unit 101
- 6104 Hilside Blom Ct Unit 201
- 6100 Hilside Blom Ct Unit 101
- 6100 Hilside Blom Ct Unit 201
- 6106 Hillside Bloom Ct Unit 101
- 7561 Violet Vista Ave Unit 201
- 7561 Violet Vista Ave Unit 101
- 7563 Violet Vista Ave Unit 101
- 6101 Crockery St
- 6106 Hilside Blom Ct Unit 101
- 6108 Hilside Blom Ct Unit 201
- 6108 Hilside Blom Ct Unit 101
- 6106 Hilside Blom Ct Unit 201
- 6115 Daisy Petal St Unit 201
- 6115 Daisy Petal St Unit 101
- 6111 Daisy Petal St Unit 101
- 6107 Daisy Petal St Unit 201