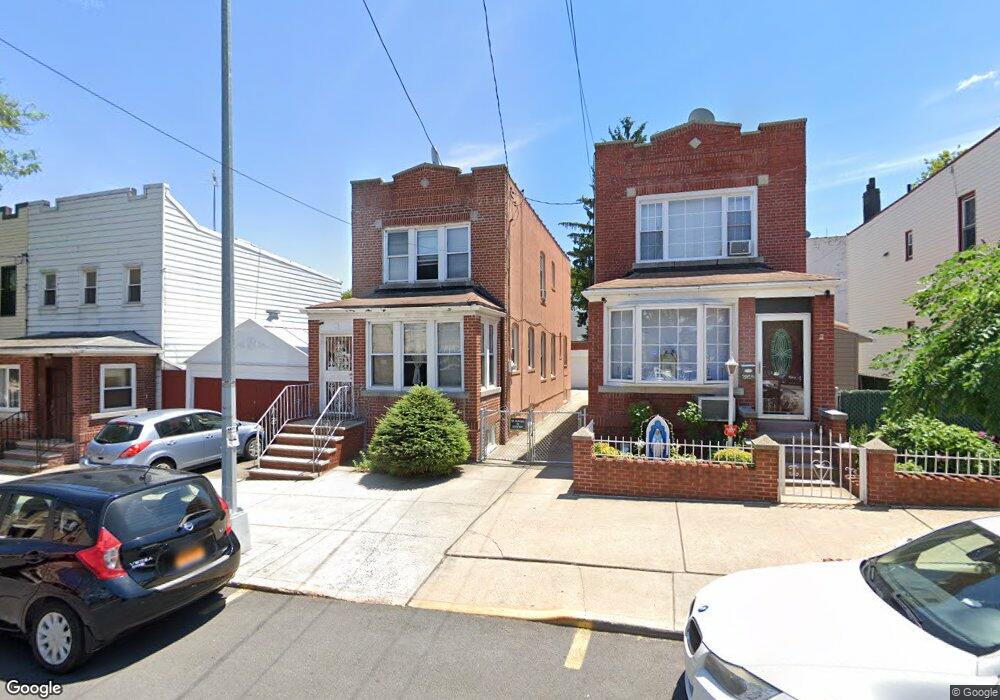
6102 Menahan St Unit 29A Ridgewood, NY 11385
Ridgewood NeighborhoodEstimated Value: $879,050 - $1,121,000
--
Bed
--
Bath
1,215
Sq Ft
$799/Sq Ft
Est. Value
About This Home
This home is located at 6102 Menahan St Unit 29A, Ridgewood, NY 11385 and is currently estimated at $971,263, approximately $799 per square foot. 6102 Menahan St Unit 29A is a home located in Queens County with nearby schools including P.S. 71 Forest, I.S. 093 Ridgewood, and Grover Cleveland High School.
Ownership History
Date
Name
Owned For
Owner Type
Purchase Details
Closed on
Jul 30, 2024
Sold by
Kilada Mona
Bought by
Dasgupta Sabar
Current Estimated Value
Home Financials for this Owner
Home Financials are based on the most recent Mortgage that was taken out on this home.
Original Mortgage
$800,000
Outstanding Balance
$790,947
Interest Rate
6.87%
Mortgage Type
Purchase Money Mortgage
Estimated Equity
$180,316
Purchase Details
Closed on
Oct 29, 2004
Sold by
Kilada George and Kilada Mona
Bought by
Kilada Mona
Purchase Details
Closed on
Jul 23, 1996
Sold by
Gaimaro Phyllis
Bought by
Kilada George and Kilada Mona
Home Financials for this Owner
Home Financials are based on the most recent Mortgage that was taken out on this home.
Original Mortgage
$85,200
Interest Rate
8.11%
Create a Home Valuation Report for This Property
The Home Valuation Report is an in-depth analysis detailing your home's value as well as a comparison with similar homes in the area
Home Values in the Area
Average Home Value in this Area
Purchase History
| Date | Buyer | Sale Price | Title Company |
|---|---|---|---|
| Dasgupta Sabar | $999,975 | -- | |
| Kilada Mona | -- | -- | |
| Kilada Mona | -- | -- | |
| Kilada George | $142,000 | Chicago Title Insurance Co | |
| Kilada George | $142,000 | Chicago Title Insurance Co |
Source: Public Records
Mortgage History
| Date | Status | Borrower | Loan Amount |
|---|---|---|---|
| Open | Dasgupta Sabar | $800,000 | |
| Previous Owner | Kilada George | $85,200 |
Source: Public Records
Tax History Compared to Growth
Tax History
| Year | Tax Paid | Tax Assessment Tax Assessment Total Assessment is a certain percentage of the fair market value that is determined by local assessors to be the total taxable value of land and additions on the property. | Land | Improvement |
|---|---|---|---|---|
| 2025 | $5,962 | $32,950 | $7,206 | $25,744 |
| 2024 | $5,974 | $31,085 | $6,555 | $24,530 |
| 2023 | $5,609 | $29,327 | $5,486 | $23,841 |
| 2022 | $2,102 | $46,080 | $9,540 | $36,540 |
| 2021 | $2,236 | $43,500 | $9,540 | $33,960 |
| 2020 | $2,247 | $45,480 | $9,540 | $35,940 |
| 2019 | $2,050 | $50,100 | $9,540 | $40,560 |
| 2018 | $1,832 | $24,439 | $5,027 | $19,412 |
| 2017 | $4,061 | $23,056 | $5,229 | $17,827 |
| 2016 | $4,274 | $23,056 | $5,229 | $17,827 |
| 2015 | $2,404 | $22,882 | $7,685 | $15,197 |
| 2014 | $2,404 | $21,587 | $8,704 | $12,883 |
Source: Public Records
Map
Nearby Homes
- 61-25 Menahan St
- 6334 Fresh Pond Rd Unit 4G
- 6334 Fresh Pond Rd Unit 2G
- 63-34 Fresh Pond Rd Unit 3G
- 60-14 Menahan St
- 60-12 Menahan St
- 6185 Grove St
- 61-85 Grove St
- 6018 Bleecker St
- 5932 Grove St
- 5929 Linden St
- 6157 Linden St
- 6315 Forest Ave Unit 1A
- 6161 62nd Ave
- 62-60 60th St
- 64-13 Metropolitan Ave
- 62-47 64th St
- 63-16 Forest Ave Unit 1B
- 6127 62nd St
- 65-26 Admiral Ave
- 6104 Menahan St
- 6106 Menahan St
- 6102 Menahan St
- 6108 Menahan St
- 6042 Menahan St
- 6338 61st St
- 6112 Menahan St
- 6036 Menahan St
- 61-12 Menahan St
- 6036 Menahan St
- 6036 Menahan St Unit 2
- 6340 61st St
- 6337 Bunnecke Ct
- 6116 Menahan St
- 6034 Menahan St
- 6342 61st St
- 6339 Bunnecke Ct
- 61-18 Menahan St Unit 1st Fl
- 61-18 Menahan St
- 61-18 Menahan St Unit 2