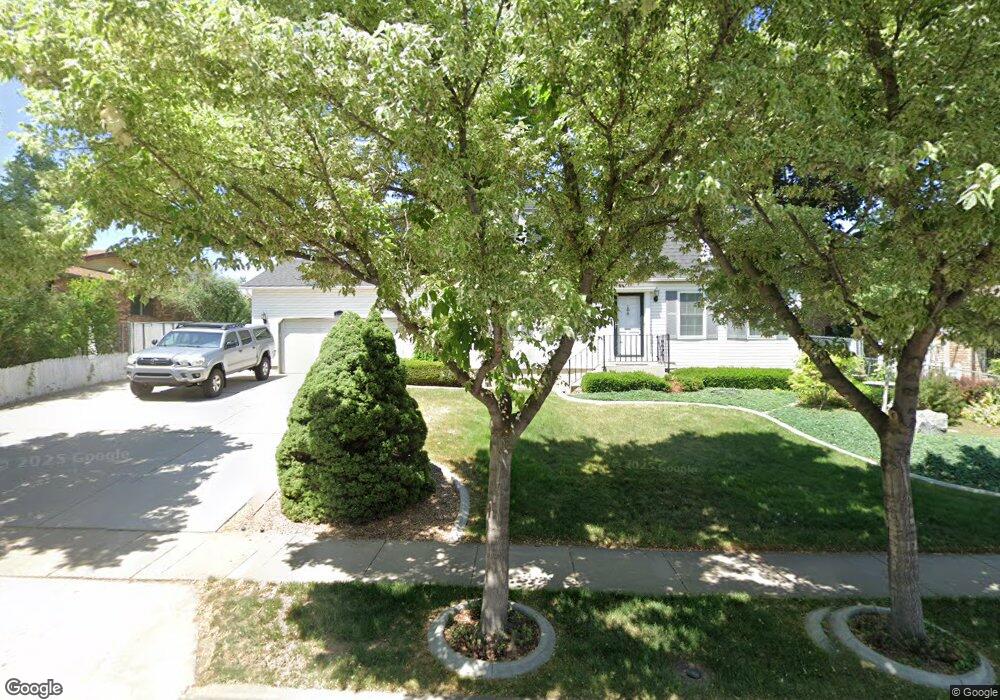
6102 S Clara Dr Taylorsville, UT 84129
Estimated Value: $605,759 - $629,000
5
Beds
3
Baths
3,190
Sq Ft
$194/Sq Ft
Est. Value
About This Home
This home is located at 6102 S Clara Dr, Taylorsville, UT 84129 and is currently estimated at $618,440, approximately $193 per square foot. 6102 S Clara Dr is a home located in Salt Lake County with nearby schools including Calvin S Smith Elementary School, Bennion Junior High School, and Taylorsville High School.
Ownership History
Date
Name
Owned For
Owner Type
Purchase Details
Closed on
Sep 29, 2023
Sold by
Robert And Angela Osness Family Trust
Bought by
Vance Tyson and Vance Lindsay
Current Estimated Value
Home Financials for this Owner
Home Financials are based on the most recent Mortgage that was taken out on this home.
Original Mortgage
$225,000
Outstanding Balance
$220,550
Interest Rate
7.09%
Mortgage Type
New Conventional
Estimated Equity
$397,890
Purchase Details
Closed on
Jan 25, 2017
Sold by
Osness Robert Q and Osness Angela R
Bought by
Osncess Robert Q and Osncess Angela R
Purchase Details
Closed on
May 18, 1995
Sold by
Allen John A and Allen Mandy Stuivenvolt
Bought by
Osness Robert Q and Osness Angela R
Home Financials for this Owner
Home Financials are based on the most recent Mortgage that was taken out on this home.
Original Mortgage
$114,000
Interest Rate
8.07%
Create a Home Valuation Report for This Property
The Home Valuation Report is an in-depth analysis detailing your home's value as well as a comparison with similar homes in the area
Home Values in the Area
Average Home Value in this Area
Purchase History
| Date | Buyer | Sale Price | Title Company |
|---|---|---|---|
| Vance Tyson | -- | Cottonwood Title | |
| Osncess Robert Q | -- | None Available | |
| Osness Robert Q | -- | -- |
Source: Public Records
Mortgage History
| Date | Status | Borrower | Loan Amount |
|---|---|---|---|
| Open | Vance Tyson | $225,000 | |
| Previous Owner | Osness Robert Q | $114,000 |
Source: Public Records
Tax History Compared to Growth
Tax History
| Year | Tax Paid | Tax Assessment Tax Assessment Total Assessment is a certain percentage of the fair market value that is determined by local assessors to be the total taxable value of land and additions on the property. | Land | Improvement |
|---|---|---|---|---|
| 2025 | $3,571 | $613,600 | $163,500 | $450,100 |
| 2024 | $3,571 | $553,900 | $152,900 | $401,000 |
| 2023 | $2,820 | $453,600 | $147,000 | $306,600 |
| 2022 | $2,905 | $471,400 | $144,100 | $327,300 |
| 2021 | $3,336 | $373,100 | $110,900 | $262,200 |
| 2020 | $2,478 | $331,400 | $102,500 | $228,900 |
| 2019 | $2,459 | $321,100 | $96,600 | $224,500 |
| 2018 | $0 | $294,200 | $96,600 | $197,600 |
| 2017 | $1,915 | $253,400 | $96,600 | $156,800 |
| 2016 | $1,768 | $233,800 | $96,600 | $137,200 |
| 2015 | $1,641 | $202,800 | $90,800 | $112,000 |
| 2014 | -- | $193,500 | $87,900 | $105,600 |
Source: Public Records
Map
Nearby Homes
- 2342 W 6200 S
- 2322 W Surrey Rd
- 2137 W 6200 S
- 2337 Sharron Dr
- 2332 Broderick Dr
- 2126 W Happiness Dr
- 6016 S Paprika Cir
- 5924 S Jordan Canal Rd
- 2333 W Ledgewood Dr
- 6474 Tamra Dr
- 2579 W 5780 S
- 2250 W Tierra Rose Dr
- 6007 S Sweet Basil N
- 6438 Mckinley Ln
- 5980 S Sweet Basil N
- 6095 S Sierra Grande Dr
- 5725 S 2665 W
- 5668 Lolene Way
- 3075 Don Francisco Dr Unit 159
- 3052 W Matterhorn Dr