Estimated Value: $391,295 - $490,000
Studio
--
Bath
3,447
Sq Ft
$134/Sq Ft
Est. Value
About This Home
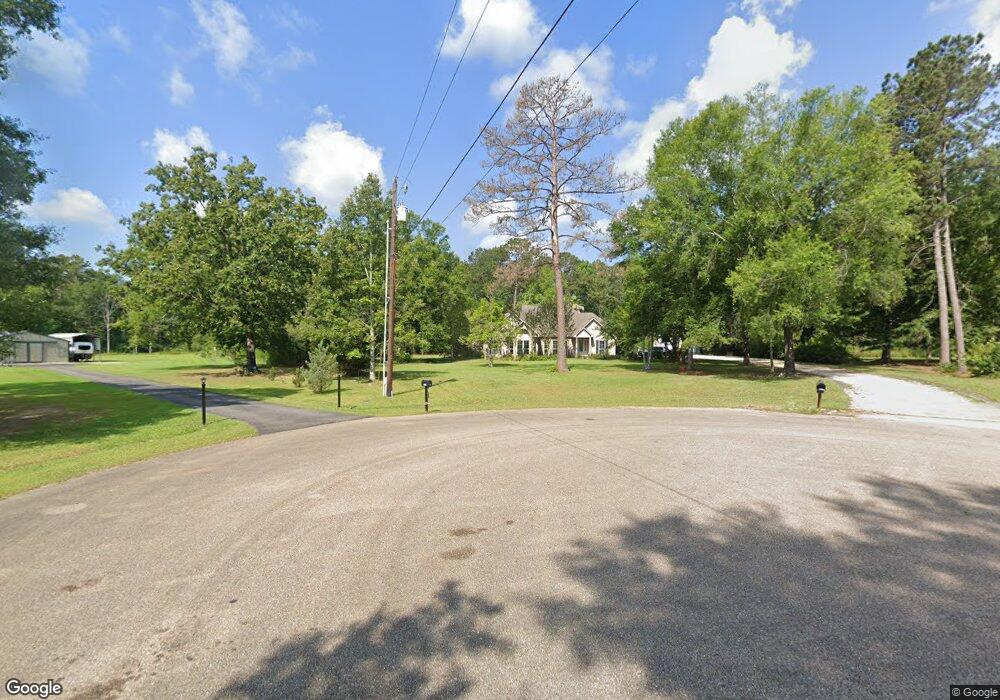
This home is located at 61021 Doe Run Dr, Amite, LA 70422 and is currently estimated at $460,824, approximately $133 per square foot. 61021 Doe Run Dr is a home located in Tangipahoa Parish with nearby schools including Amite Elementary Magnet School, Amite Westside Middle Magnet, and Amite High Magnet.
Ownership History
Date
Name
Owned For
Owner Type
Purchase Details
Closed on
Feb 19, 2019
Sold by
7 Smiths Co Llc
Bought by
Hallmark William S
Current Estimated Value
Home Financials for this Owner
Home Financials are based on the most recent Mortgage that was taken out on this home.
Original Mortgage
$320,095
Outstanding Balance
$281,421
Interest Rate
4.5%
Mortgage Type
Stand Alone Refi Refinance Of Original Loan
Estimated Equity
$179,403
Purchase Details
Closed on
Feb 15, 2019
Sold by
7 Smiths Co Llc
Bought by
Hallmark William S
Home Financials for this Owner
Home Financials are based on the most recent Mortgage that was taken out on this home.
Original Mortgage
$320,095
Outstanding Balance
$281,421
Interest Rate
4.5%
Mortgage Type
Stand Alone Refi Refinance Of Original Loan
Estimated Equity
$179,403
Purchase Details
Closed on
Oct 25, 2013
Sold by
Spence Lowell R
Bought by
Seven Smiths Company Llc
Create a Home Valuation Report for This Property
The Home Valuation Report is an in-depth analysis detailing your home's value as well as a comparison with similar homes in the area
Purchase History
| Date | Buyer | Sale Price | Title Company |
|---|---|---|---|
| Hallmark William S | $326,000 | -- | |
| Hallmark William S | $326,000 | -- | |
| Seven Smiths Company Llc | $360,000 | None Available |
Source: Public Records
Mortgage History
| Date | Status | Borrower | Loan Amount |
|---|---|---|---|
| Open | Hallmark William S | $320,095 | |
| Closed | Hallmark William S | $320,095 |
Source: Public Records
Tax History
| Year | Tax Paid | Tax Assessment Tax Assessment Total Assessment is a certain percentage of the fair market value that is determined by local assessors to be the total taxable value of land and additions on the property. | Land | Improvement |
|---|---|---|---|---|
| 2024 | $2,499 | $32,575 | $2,123 | $30,452 |
| 2023 | $2,524 | $32,728 | $1,966 | $30,762 |
| 2022 | $2,524 | $32,728 | $1,966 | $30,762 |
| 2021 | $1,826 | $32,728 | $1,966 | $30,762 |
| 2020 | $2,688 | $32,728 | $1,966 | $30,762 |
| 2019 | $2,612 | $31,796 | $1,966 | $29,830 |
| 2018 | $2,581 | $31,796 | $1,966 | $29,830 |
| 2017 | $2,517 | $31,796 | $1,966 | $29,830 |
| 2016 | $2,582 | $31,796 | $1,966 | $29,830 |
| 2015 | $2,723 | $32,728 | $1,966 | $30,762 |
| 2014 | $2,787 | $32,728 | $1,966 | $30,762 |
Source: Public Records
Map
Nearby Homes
- 17049 Eastwood Dr
- 17317 Airport Rd
- 61180 Doe Run Dr
- 17134 Airport Rd
- 60222 N Bell Rd
- 18252 Highway 16
- 62057 Louisiana 1054
- 512627 Louisiana 16
- TBD 6.982 AC Providence Estates Rd
- 18065 Back Ridge Rd
- 0 Louisiana 1054
- 0 Vfw Rd
- Tract C Mcclendon Ln
- 19181 Rolling Pines Rd
- TBD Flamenco Rd
- 61027 Ruth Holton Rd
- 60412 Ruth Holton Rd
- TBD Ruth Holton Rd
- 60181 Anderson Ln
- 0 Russell Town Rd Unit 2506625
- 61043 Doe Run Dr
- 61022 Doe Run Dr
- 17188 Highway 16
- 17188 Highway 16
- 61052 Doe Run Dr
- 61068 Doe Run Dr
- 0 Doe Run II Blvd
- 17372 Highway 16
- 5 Doe Run Dr
- 61094 Doe Run Dr
- 15 Doe Run Dr
- 17015 Eastwood Dr
- 0 Doe Run Dr
- 17267 Highway 16
- 17297 Highway 16
- 61150 Doe Run Dr
- 61150 Doe Run Dr
- 17203 Louisiana 16
- 17203 Highway 16
- 17188 Louisiana 16