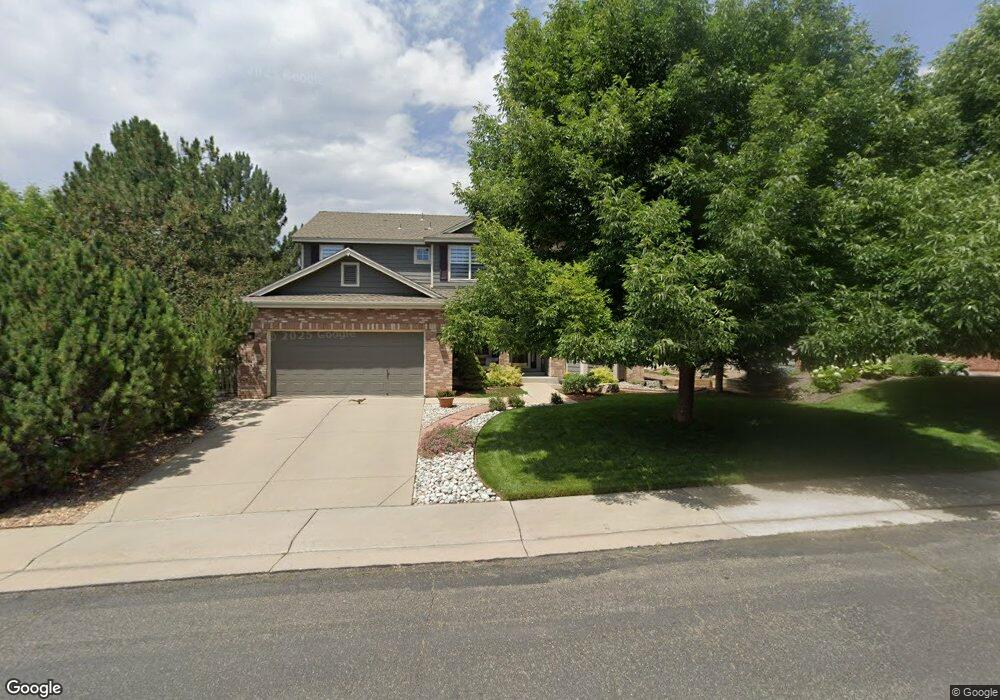
6103 Devinney Way Arvada, CO 80004
Ralston Valley NeighborhoodEstimated Value: $816,000 - $984,000
3
Beds
5
Baths
2,471
Sq Ft
$360/Sq Ft
Est. Value
About This Home
This home is located at 6103 Devinney Way, Arvada, CO 80004 and is currently estimated at $890,365, approximately $360 per square foot. 6103 Devinney Way is a home located in Jefferson County with nearby schools including Fremont Elementary School, Drake Junior High School, and Arvada West High School.
Ownership History
Date
Name
Owned For
Owner Type
Purchase Details
Closed on
Nov 19, 2001
Sold by
Harper Jan C and Harper Terri D
Bought by
Parker Daniel D and Parker Krissa A
Current Estimated Value
Home Financials for this Owner
Home Financials are based on the most recent Mortgage that was taken out on this home.
Original Mortgage
$259,000
Outstanding Balance
$100,110
Interest Rate
6.57%
Estimated Equity
$790,255
Purchase Details
Closed on
Jul 7, 1999
Sold by
Village Homes Of Colorado Inc
Bought by
Harper Jan C and Harper Terri D
Home Financials for this Owner
Home Financials are based on the most recent Mortgage that was taken out on this home.
Original Mortgage
$246,950
Interest Rate
7.21%
Create a Home Valuation Report for This Property
The Home Valuation Report is an in-depth analysis detailing your home's value as well as a comparison with similar homes in the area
Home Values in the Area
Average Home Value in this Area
Purchase History
| Date | Buyer | Sale Price | Title Company |
|---|---|---|---|
| Parker Daniel D | $342,500 | -- | |
| Harper Jan C | $274,403 | Land Title |
Source: Public Records
Mortgage History
| Date | Status | Borrower | Loan Amount |
|---|---|---|---|
| Open | Parker Daniel D | $259,000 | |
| Previous Owner | Harper Jan C | $246,950 | |
| Closed | Parker Daniel D | $40,000 |
Source: Public Records
Tax History
| Year | Tax Paid | Tax Assessment Tax Assessment Total Assessment is a certain percentage of the fair market value that is determined by local assessors to be the total taxable value of land and additions on the property. | Land | Improvement |
|---|---|---|---|---|
| 2024 | $5,065 | $52,220 | $21,936 | $30,284 |
| 2023 | $5,065 | $52,220 | $21,936 | $30,284 |
| 2022 | $4,192 | $42,807 | $16,668 | $26,139 |
| 2021 | $4,262 | $44,040 | $17,148 | $26,892 |
| 2020 | $4,028 | $41,740 | $16,638 | $25,102 |
| 2019 | $3,974 | $41,740 | $16,638 | $25,102 |
| 2018 | $3,723 | $38,027 | $11,465 | $26,562 |
| 2017 | $3,408 | $38,027 | $11,465 | $26,562 |
| 2016 | $3,257 | $34,225 | $7,861 | $26,364 |
| 2015 | $3,194 | $34,225 | $7,861 | $26,364 |
| 2014 | $3,194 | $31,544 | $8,038 | $23,506 |
Source: Public Records
Map
Nearby Homes
- 6060 Deframe Ct
- 12321 W 58th Dr
- 6329 Braun Cir
- 6363 Cole Ln
- 6369 Cole Ln
- 6262 Braun Cir
- 5276 Flora Way
- 5316 Flora Way
- 13812 W 64th Place
- 5726 Fig Ct
- 13750 W 65th Ave
- 13155 W 63rd Place
- 13400 W 65th Ave
- 5683 Fig Way
- 13030 W 58th Ave
- 6409 Zang St Unit A
- 14880 W 58th Ave
- 12924 W 64th Dr Unit B
- 6128 Xenon St
- 6223 Kilmer Loop Unit 201
- 6113 Devinney Way
- 6102 Devinney Way
- 6053 Devinney Way
- 6112 Devinney Way
- 6104 Devinney Ct
- 6062 Devinney Way
- 6122 Devinney Way
- 6044 Devinney Ct
- 6033 Devinney Way
- 6236 Devinney Cir
- 6124 Devinney Ct
- 6034 Devinney Ct
- 6238 Devinney Cir
- 6052 Devinney Way
- 6234 Devinney Cir
- 6132 Devinney Way
- 6081 Deframe Ct
- 6024 Devinney Ct
- 6042 Devinney Way
- 6244 Devinney Cir