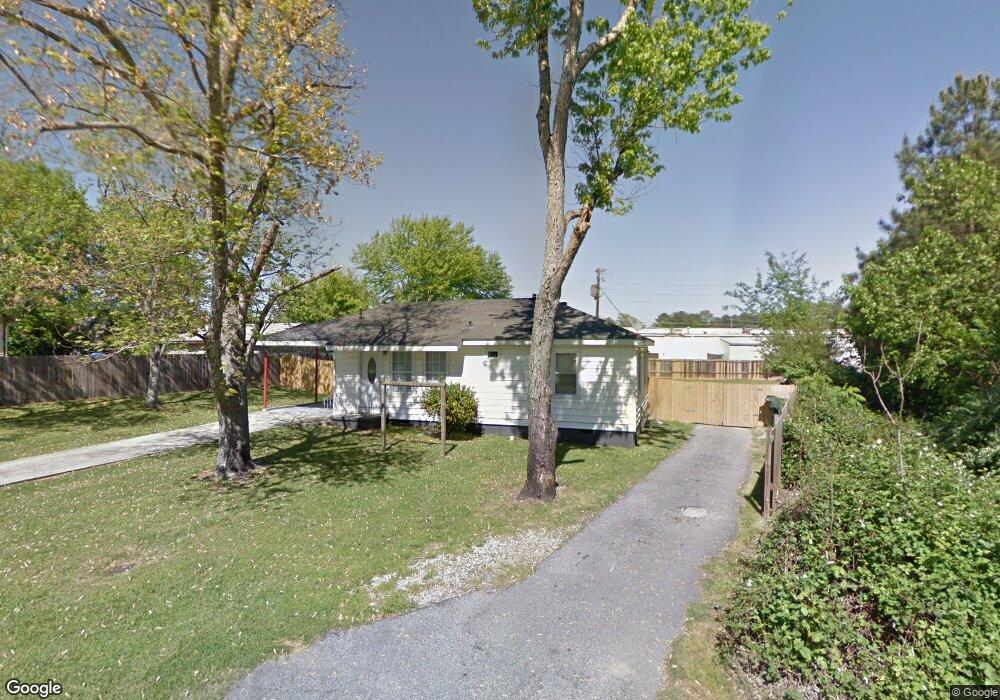
6103 Lynne Cir SW Mableton, GA 30126
Estimated Value: $200,091 - $222,000
2
Beds
1
Bath
864
Sq Ft
$244/Sq Ft
Est. Value
About This Home
This home is located at 6103 Lynne Cir SW, Mableton, GA 30126 and is currently estimated at $210,773, approximately $243 per square foot. 6103 Lynne Cir SW is a home located in Cobb County with nearby schools including Clay-Harmony Leland Elementary School, Lindley Middle School, and Pebblebrook High School.
Ownership History
Date
Name
Owned For
Owner Type
Purchase Details
Closed on
Aug 22, 2007
Sold by
Fisher Shou T
Bought by
Camarena Simon
Current Estimated Value
Home Financials for this Owner
Home Financials are based on the most recent Mortgage that was taken out on this home.
Original Mortgage
$50,000
Interest Rate
6.65%
Mortgage Type
New Conventional
Purchase Details
Closed on
Apr 29, 2004
Sold by
Schouest Michael P and Schouest Kim P
Bought by
Fisher Shou T
Home Financials for this Owner
Home Financials are based on the most recent Mortgage that was taken out on this home.
Original Mortgage
$78,800
Interest Rate
5.36%
Mortgage Type
New Conventional
Purchase Details
Closed on
Sep 11, 2001
Sold by
Weathington Larry N
Bought by
Schouest Michael P
Home Financials for this Owner
Home Financials are based on the most recent Mortgage that was taken out on this home.
Original Mortgage
$70,500
Interest Rate
6.98%
Mortgage Type
New Conventional
Create a Home Valuation Report for This Property
The Home Valuation Report is an in-depth analysis detailing your home's value as well as a comparison with similar homes in the area
Home Values in the Area
Average Home Value in this Area
Purchase History
| Date | Buyer | Sale Price | Title Company |
|---|---|---|---|
| Camarena Simon | $100,000 | -- | |
| Fisher Shou T | $98,500 | -- | |
| Schouest Michael P | $94,000 | -- |
Source: Public Records
Mortgage History
| Date | Status | Borrower | Loan Amount |
|---|---|---|---|
| Closed | Camarena Simon | $50,000 | |
| Previous Owner | Fisher Shou T | $78,800 | |
| Previous Owner | Schouest Michael P | $70,500 |
Source: Public Records
Tax History Compared to Growth
Tax History
| Year | Tax Paid | Tax Assessment Tax Assessment Total Assessment is a certain percentage of the fair market value that is determined by local assessors to be the total taxable value of land and additions on the property. | Land | Improvement |
|---|---|---|---|---|
| 2025 | $568 | $81,332 | $18,000 | $63,332 |
| 2024 | $522 | $65,316 | $22,000 | $43,316 |
| 2023 | $281 | $53,848 | $26,000 | $27,848 |
| 2022 | $471 | $48,564 | $26,000 | $22,564 |
| 2021 | $471 | $48,564 | $26,000 | $22,564 |
| 2020 | $1,474 | $48,564 | $26,000 | $22,564 |
| 2019 | $1,474 | $48,564 | $26,000 | $22,564 |
| 2018 | $925 | $30,492 | $10,000 | $20,492 |
| 2017 | $813 | $28,268 | $8,000 | $20,268 |
| 2016 | $638 | $22,188 | $8,000 | $14,188 |
| 2015 | $468 | $15,896 | $6,000 | $9,896 |
| 2014 | $472 | $15,896 | $0 | $0 |
Source: Public Records
Map
Nearby Homes
- KNOLLWOOD Plan at Mableton Station - Townhomes
- 6243 Honeybell Aly
- Harbor Plan at Mableton Station
- Robie Plan at Mableton Station
- Aisle Plan at Mableton Station
- Elston Plan at Mableton Station
- 537 Elizabeth Ln SW
- 496 Elizabeth Ln SW
- 220 Lane Dr
- 5981 Pisgah Rd SW
- 317 Community Dr SW
- 6281 Denny Ln SW
- 6365 Susan Dr SW
- 767 Kenneth Ln SW
- 5859 Lone Oak Dr SW
- 6251 Honeybell Aly
- 489 Lee Rd SW
- 6266 Britt Rd SW
- Magnolia Plan at The Overlook at Factory Shoals - Georgian Series
- Axley Plan at The Overlook at Factory Shoals - Georgian Series
- 6093 Lynne Cir SW
- 6084 Mableton Pkwy SW
- 6083 Lynne Cir SW
- Lot 9 Lynne Cir
- 6096 Lynne Cir SW
- 6116 Mableton Pkwy SW
- 6132 Lynne Cir SW
- 6108 Lynne Cir SW
- 554 Boggs Rd SW
- 6084 Lynne Cir SW
- 570 Boggs Rd SW
- 6131 Lynne Cir SW
- 0 Lynne Cir SW Unit 8249992
- 0 Lynne Cir SW Unit 5900724
- 0 Lynne Cir SW Unit 9 7610085
- 0 Lynne Cir SW Unit 9 7610084
- 09 Lynne Cir SW
- 0 Lynne Cir SW
- 0 Lynne Cir SW Unit 8123012
- 0 Lynne Cir SW Unit 8653428