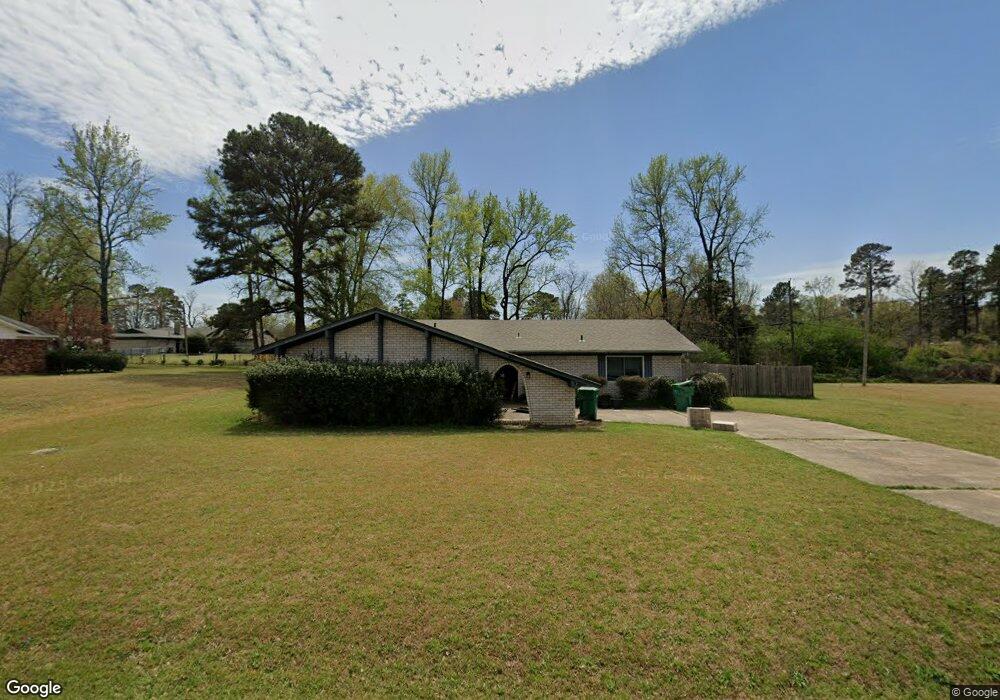
6103 Sleepy Hollow Ave Unit n/a Texarkana, TX 75503
Estimated Value: $187,000 - $195,000
--
Bed
2
Baths
1,294
Sq Ft
$148/Sq Ft
Est. Value
About This Home
This home is located at 6103 Sleepy Hollow Ave Unit n/a, Texarkana, TX 75503 and is currently estimated at $191,066, approximately $147 per square foot. 6103 Sleepy Hollow Ave Unit n/a is a home located in Bowie County with nearby schools including Margaret Fischer Davis Elementary School, Pleasant Grove Intermediate School, and Pleasant Grove Middle School.
Ownership History
Date
Name
Owned For
Owner Type
Purchase Details
Closed on
Oct 9, 2025
Sold by
Slough Kevin D and Slough Stacy
Bought by
Cooper Kullen Blake
Current Estimated Value
Home Financials for this Owner
Home Financials are based on the most recent Mortgage that was taken out on this home.
Original Mortgage
$186,675
Outstanding Balance
$186,508
Interest Rate
6.56%
Mortgage Type
New Conventional
Estimated Equity
$4,558
Purchase Details
Closed on
Jul 19, 2023
Sold by
Papa Romeo Properties Llc
Bought by
Slough Kevin D and Slough Stacy
Home Financials for this Owner
Home Financials are based on the most recent Mortgage that was taken out on this home.
Original Mortgage
$173,794
Interest Rate
6.71%
Mortgage Type
FHA
Purchase Details
Closed on
Mar 13, 2020
Sold by
Campbell Bruce and Campbell Marlene
Bought by
Papa Romeo Properties Llc
Home Financials for this Owner
Home Financials are based on the most recent Mortgage that was taken out on this home.
Original Mortgage
$118,337
Interest Rate
3.5%
Mortgage Type
Future Advance Clause Open End Mortgage
Purchase Details
Closed on
Mar 24, 2010
Sold by
Yeager Stephen D and Yeager Karen L
Bought by
Campbell Jack and Campbell Lucy
Create a Home Valuation Report for This Property
The Home Valuation Report is an in-depth analysis detailing your home's value as well as a comparison with similar homes in the area
Home Values in the Area
Average Home Value in this Area
Purchase History
| Date | Buyer | Sale Price | Title Company |
|---|---|---|---|
| Cooper Kullen Blake | -- | Capital Title | |
| Slough Kevin D | -- | Capital Title | |
| Papa Romeo Properties Llc | -- | Twin City Title | |
| Campbell Jack | -- | None Available |
Source: Public Records
Mortgage History
| Date | Status | Borrower | Loan Amount |
|---|---|---|---|
| Open | Cooper Kullen Blake | $186,675 | |
| Previous Owner | Slough Kevin D | $173,794 | |
| Previous Owner | Papa Romeo Properties Llc | $118,337 |
Source: Public Records
Tax History Compared to Growth
Tax History
| Year | Tax Paid | Tax Assessment Tax Assessment Total Assessment is a certain percentage of the fair market value that is determined by local assessors to be the total taxable value of land and additions on the property. | Land | Improvement |
|---|---|---|---|---|
| 2025 | $3,937 | $181,195 | $25,000 | $156,195 |
| 2024 | $3,937 | $176,909 | $25,000 | $151,909 |
| 2023 | $3,801 | $168,827 | $25,000 | $143,827 |
| 2022 | $3,792 | $154,411 | $25,000 | $129,411 |
| 2021 | $3,365 | $128,677 | $20,000 | $108,677 |
| 2020 | $2,630 | $100,049 | $20,000 | $80,049 |
| 2019 | $2,604 | $96,550 | $20,000 | $76,550 |
| 2018 | $2,660 | $99,162 | $20,000 | $79,162 |
| 2017 | $2,614 | $97,721 | $20,000 | $77,721 |
| 2016 | $2,614 | $97,721 | $20,000 | $77,721 |
| 2015 | $2,586 | $98,996 | $20,000 | $78,996 |
| 2014 | $2,586 | $96,183 | $20,000 | $76,183 |
Source: Public Records
Map
Nearby Homes
- 5703 Sleepy Hollow Ave
- 6106 Sagebrush Ave
- 6703 Richmond Rd
- 5703 Forest Grove Rd
- 6312 Chaparral St
- Lot 2 Blk 2 Cooper Lane Est III
- 6814 Maple View Ln
- 0 Briarwood Cir
- 6826 Maple View Ln
- 6108 Pebble Brook Dr
- 36 Briarwood Cir
- 6605 Chaparral St
- 5500 Pleasant Grove Rd
- 7303 Old Spanish Dr
- 6917 Woodmere Ct
- 33 Leggett Dr
- 8304 Greenhead Dr
- TBD Lionel Ave
- 8308 Greenhead Dr
- 8414 Mandarin Cove
- 6101 Sleepy Hollow Ave
- 6201 Sleepy Hollow Ave
- 6005 Wilshire Dr
- 6102 Sleepy Hollow Ave
- 6202 Sleepy Hollow Ave
- 6007 Wilshire Dr
- 6204 Sleepy Hollow Ave
- 6107 Turtle Creek Dr
- 6209 Sleepy Hollow Ave
- 5910 Wilshire Dr
- 6010 Sleepy Hollow Ave
- 6001 Wilshire Dr
- 6 Turtle Creek Rd
- 5909 Turtle Creek Dr
- 6006 Turtle Creek Dr
- 6109 Turtle Creek Dr
- 6213 Sleepy Hollow Ave
- 6206 Sleepy Hollow Ave
- 5911 Wilshire Dr
- 6009 Oak Flat Ave