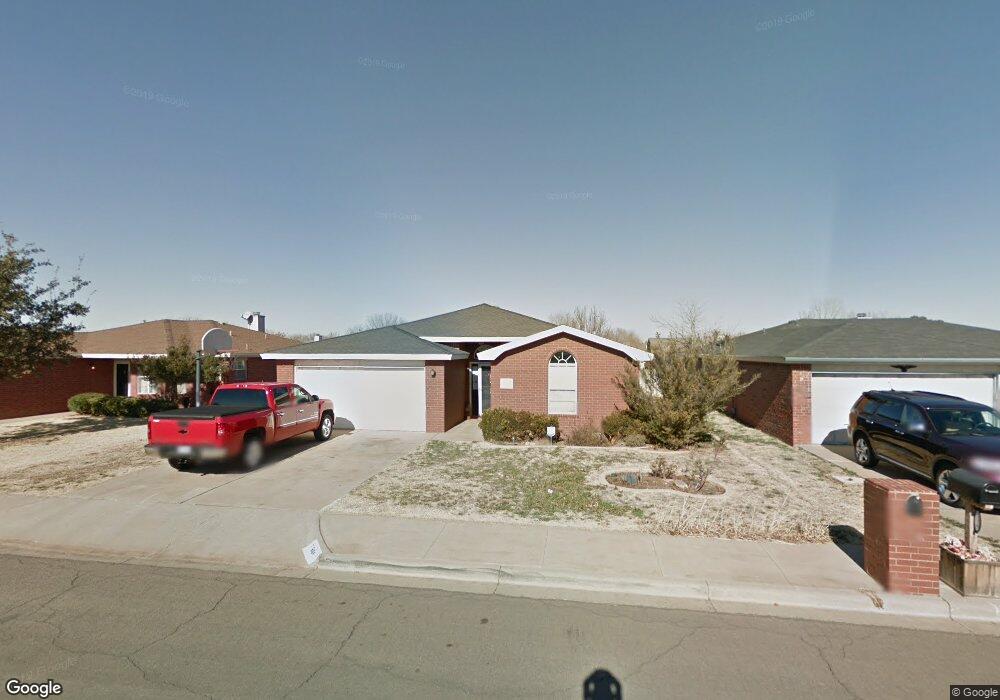
6104 8th St Lubbock, TX 79416
Northridge NeighborhoodEstimated Value: $189,000 - $195,000
3
Beds
2
Baths
1,448
Sq Ft
$132/Sq Ft
Est. Value
About This Home
This home is located at 6104 8th St, Lubbock, TX 79416 and is currently estimated at $191,815, approximately $132 per square foot. 6104 8th St is a home located in Lubbock County with nearby schools including North Ridge Elementary School, Terra Vista Middle School, and Frenship High School.
Ownership History
Date
Name
Owned For
Owner Type
Purchase Details
Closed on
Feb 8, 2021
Sold by
Tdb Investments Llc
Bought by
Jones Lauren M
Current Estimated Value
Home Financials for this Owner
Home Financials are based on the most recent Mortgage that was taken out on this home.
Original Mortgage
$118,437
Outstanding Balance
$105,837
Interest Rate
2.65%
Mortgage Type
FHA
Estimated Equity
$85,978
Purchase Details
Closed on
May 26, 2016
Sold by
Abbe Eric W and Sandy Pienda
Bought by
Tdb Investment Llc
Purchase Details
Closed on
Jun 7, 2006
Sold by
Tran Uyen D
Bought by
Pineda Abbe Eric Wayne and Pineda Abbe Sandy
Home Financials for this Owner
Home Financials are based on the most recent Mortgage that was taken out on this home.
Original Mortgage
$95,000
Interest Rate
6.56%
Mortgage Type
Purchase Money Mortgage
Purchase Details
Closed on
Apr 25, 2005
Sold by
Spillers Cedric Anthony
Bought by
Tdb Investment Llc
Create a Home Valuation Report for This Property
The Home Valuation Report is an in-depth analysis detailing your home's value as well as a comparison with similar homes in the area
Home Values in the Area
Average Home Value in this Area
Purchase History
| Date | Buyer | Sale Price | Title Company |
|---|---|---|---|
| Jones Lauren M | -- | Service Title | |
| Tdb Investment Llc | -- | -- | |
| Pineda Abbe Eric Wayne | $100,000 | None Available | |
| Tdb Investment Llc | -- | -- |
Source: Public Records
Mortgage History
| Date | Status | Borrower | Loan Amount |
|---|---|---|---|
| Open | Jones Lauren M | $118,437 | |
| Previous Owner | Pineda Abbe Eric Wayne | $95,000 |
Source: Public Records
Tax History Compared to Growth
Tax History
| Year | Tax Paid | Tax Assessment Tax Assessment Total Assessment is a certain percentage of the fair market value that is determined by local assessors to be the total taxable value of land and additions on the property. | Land | Improvement |
|---|---|---|---|---|
| 2025 | $2,761 | $189,300 | $18,000 | $171,300 |
| 2024 | $2,761 | $189,761 | $18,000 | $171,761 |
| 2023 | $3,788 | $180,885 | $18,000 | $162,885 |
| 2022 | $3,744 | $164,441 | $18,000 | $146,441 |
| 2021 | $3,385 | $139,989 | $18,000 | $121,989 |
| 2020 | $3,310 | $136,242 | $18,000 | $118,242 |
| 2019 | $3,241 | $129,629 | $18,000 | $111,629 |
| 2018 | $3,189 | $127,401 | $18,000 | $109,401 |
| 2017 | $3,088 | $123,217 | $18,000 | $105,217 |
| 2016 | $2,958 | $118,035 | $9,600 | $108,435 |
| 2015 | $2,401 | $111,992 | $9,600 | $102,392 |
| 2014 | $2,401 | $104,809 | $9,600 | $95,209 |
Source: Public Records
Map
Nearby Homes