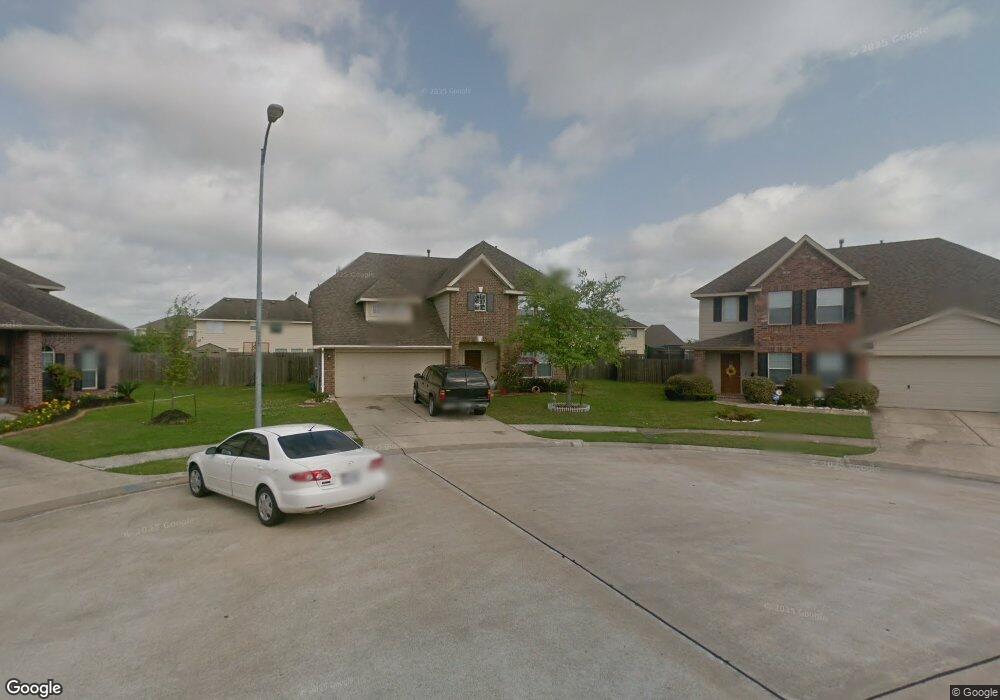
6105 Cypress Village Ct Pearland, TX 77584
Estimated Value: $329,000 - $357,000
5
Beds
3
Baths
2,352
Sq Ft
$146/Sq Ft
Est. Value
About This Home
This home is located at 6105 Cypress Village Ct, Pearland, TX 77584 and is currently estimated at $342,823, approximately $145 per square foot. 6105 Cypress Village Ct is a home located in Brazoria County with nearby schools including Massey Ranch Elementary School, Sam Jamison Middle School, and Pearland Junior High School South.
Ownership History
Date
Name
Owned For
Owner Type
Purchase Details
Closed on
Jan 14, 2009
Sold by
Household Finance Corp Iii
Bought by
Viscaino Frank F and Aguire Patricia
Current Estimated Value
Home Financials for this Owner
Home Financials are based on the most recent Mortgage that was taken out on this home.
Original Mortgage
$142,348
Outstanding Balance
$89,542
Interest Rate
5.09%
Mortgage Type
FHA
Estimated Equity
$253,281
Purchase Details
Closed on
Oct 7, 2008
Sold by
Kann Bernard and Kann Racheal
Bought by
Household Finance Corporation Iii
Purchase Details
Closed on
Aug 13, 2004
Sold by
K Hovanian Of Houston Ii Lp
Bought by
Kann Bernard and Kann Racheal
Home Financials for this Owner
Home Financials are based on the most recent Mortgage that was taken out on this home.
Original Mortgage
$122,494
Interest Rate
6.65%
Mortgage Type
Purchase Money Mortgage
Create a Home Valuation Report for This Property
The Home Valuation Report is an in-depth analysis detailing your home's value as well as a comparison with similar homes in the area
Home Values in the Area
Average Home Value in this Area
Purchase History
| Date | Buyer | Sale Price | Title Company |
|---|---|---|---|
| Viscaino Frank F | -- | Lsi Title Agency | |
| Household Finance Corporation Iii | $134,404 | Lsi Title Agency | |
| Kann Bernard | -- | Alamo Title Company |
Source: Public Records
Mortgage History
| Date | Status | Borrower | Loan Amount |
|---|---|---|---|
| Open | Viscaino Frank F | $142,348 | |
| Previous Owner | Kann Bernard | $122,494 | |
| Closed | Kann Bernard | $30,623 |
Source: Public Records
Tax History Compared to Growth
Tax History
| Year | Tax Paid | Tax Assessment Tax Assessment Total Assessment is a certain percentage of the fair market value that is determined by local assessors to be the total taxable value of land and additions on the property. | Land | Improvement |
|---|---|---|---|---|
| 2025 | $5,708 | $323,310 | $54,990 | $268,320 |
| 2023 | $5,708 | $298,047 | $49,990 | $262,330 |
| 2022 | $8,153 | $304,720 | $35,930 | $268,790 |
| 2021 | $7,110 | $246,320 | $31,250 | $215,070 |
| 2020 | $6,842 | $239,390 | $31,250 | $208,140 |
| 2019 | $6,242 | $204,070 | $31,250 | $172,820 |
| 2018 | $6,259 | $204,070 | $31,250 | $172,820 |
| 2017 | $6,208 | $200,230 | $31,250 | $168,980 |
| 2016 | $6,208 | $200,230 | $31,250 | $168,980 |
| 2014 | $5,079 | $168,570 | $31,250 | $137,320 |
Source: Public Records
Map
Nearby Homes
- 3510 Dorsey Ln
- 3218 W Oaks Blvd
- 3237 Harkey Rd
- 6112 Tomorrow Cir
- 6301 Larrycrest Dr
- 6407 Hillock Ln
- 3114 Autumn Ct
- 3149 Harkey Rd
- 3610 Kale St
- 6108 Jordan Dr
- 6406 Patridge Dr
- 6204 Raintree Dr
- 6706 Paigetree Ln
- 6504 Patridge Dr
- 3730 Aubrell Rd
- 3506 Windmill Palm Dr
- 6806 Adella Ct
- 3602 Lindhaven Dr
- 3902 Bluebird Way
- 3902 Basil Ct
- 6103 Cypress Village Ct
- 3405 Dorsey Ln
- 3407 Dorsey Ln
- 6107 Cypress Village Ct
- 3409 Dorsey Ln
- 3403 Dorsey Ln
- 6101 Cypress Village Ct
- 3401 Dorsey Ln
- 6106 Cypress Village Ct
- 3404 Cypress Village Dr
- 3411 Dorsey Ln
- 6104 Cypress Village Ct
- 3402 Cypress Village Dr
- 3413 Dorsey Ln
- 6102 Cypress Village Ct
- 3418 Dorsey Ln
- 3416 Dorsey Ln
- 3420 Dorsey Ln
- 3422 Dorsey Ln
- 3414 Dorsey Ln