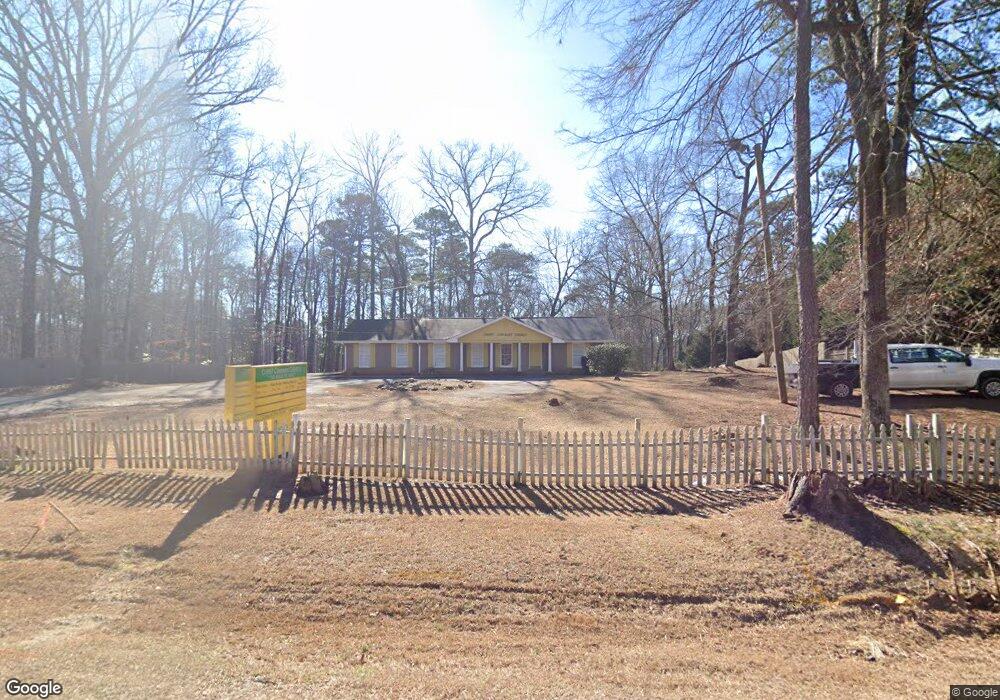
6105 Rockbridge Rd Stone Mountain, GA 30087
Estimated Value: $311,000 - $354,000
4
Beds
3
Baths
2,219
Sq Ft
$150/Sq Ft
Est. Value
About This Home
This home is located at 6105 Rockbridge Rd, Stone Mountain, GA 30087 and is currently estimated at $333,098, approximately $150 per square foot. 6105 Rockbridge Rd is a home located in DeKalb County with nearby schools including Pine Ridge Elementary School, Stephenson Middle School, and Stephenson High School.
Ownership History
Date
Name
Owned For
Owner Type
Purchase Details
Closed on
Feb 14, 2006
Sold by
Stone Robert E and Stone Joan
Bought by
Kareem Emmanuel and Kareem Juliana
Current Estimated Value
Home Financials for this Owner
Home Financials are based on the most recent Mortgage that was taken out on this home.
Original Mortgage
$166,500
Outstanding Balance
$104,677
Interest Rate
8.25%
Mortgage Type
New Conventional
Estimated Equity
$228,421
Purchase Details
Closed on
Mar 3, 2003
Sold by
Wilson Betty and Wilson Robert
Bought by
Stone Robert E and Stone Joan
Purchase Details
Closed on
Jul 23, 1999
Sold by
Stancil Robert O and And Teresa G
Bought by
Wilson Bettye F and Wilson Robert
Home Financials for this Owner
Home Financials are based on the most recent Mortgage that was taken out on this home.
Original Mortgage
$143,910
Interest Rate
7.66%
Mortgage Type
New Conventional
Create a Home Valuation Report for This Property
The Home Valuation Report is an in-depth analysis detailing your home's value as well as a comparison with similar homes in the area
Home Values in the Area
Average Home Value in this Area
Purchase History
| Date | Buyer | Sale Price | Title Company |
|---|---|---|---|
| Kareem Emmanuel | $185,000 | -- | |
| Stone Robert E | $170,000 | -- | |
| Wilson Bettye F | $159,900 | -- |
Source: Public Records
Mortgage History
| Date | Status | Borrower | Loan Amount |
|---|---|---|---|
| Open | Kareem Emmanuel | $166,500 | |
| Previous Owner | Wilson Bettye F | $143,910 |
Source: Public Records
Tax History Compared to Growth
Tax History
| Year | Tax Paid | Tax Assessment Tax Assessment Total Assessment is a certain percentage of the fair market value that is determined by local assessors to be the total taxable value of land and additions on the property. | Land | Improvement |
|---|---|---|---|---|
| 2024 | $5,121 | $107,520 | $15,560 | $91,960 |
| 2023 | $5,121 | $112,560 | $15,560 | $97,000 |
| 2022 | $4,439 | $94,000 | $15,560 | $78,440 |
| 2021 | $2,934 | $59,720 | $15,560 | $44,160 |
| 2020 | $2,715 | $54,720 | $15,560 | $39,160 |
| 2019 | $2,534 | $50,600 | $13,080 | $37,520 |
| 2018 | $2,205 | $47,760 | $13,080 | $34,680 |
| 2017 | $2,355 | $46,320 | $13,080 | $33,240 |
| 2016 | $2,385 | $46,880 | $13,080 | $33,800 |
| 2014 | $1,509 | $26,400 | $13,080 | $13,320 |
Source: Public Records
Map
Nearby Homes
- 612 Mincey Woods Ct
- 464 Stonewood Dr
- 5848 Navarre Ct
- 442 Mountain Park Trail
- 5856 Oakleaf Dr
- 437 Mount Vista Rd
- 5802 Oakleaf Dr
- 445 Mount Vista Rd
- 606 Mincey Ct
- 557 Mount Vista Rd
- 515 Rock Shadow Ct
- 504 Allana Ct
- 621 Lakewater View Dr Unit 1
- 609 Mount Vista Ct
- 507 Allana Ct
- 554 Sherwood Oaks Rd
- 447 Sherwood Cir
- 5862 Simone Dr
- 5802 Simone Dr Unit 4
- 6107 Rockbridge Rd
- 6085 Rockbridge Rd
- 6079 Rockbridge Rd
- 5031 Mincey Rd
- 6073 Rockbridge Rd
- 6131 Rockbridge Rd SW
- 324 Valley Lake Dr
- 6131 Rockbridge Rd
- 6117 Rockbridge Rd
- 6061 Rockbridge Rd
- 6134 Rockbridge Rd
- 338 Valley Lake Dr
- 6142 Rockbridge Rd
- 281 Valley Lake Dr
- 350 Valley Lake Dr
- 6161 Rockbridge Rd
- 6051 Rockbridge Rd
- 339 Valley Lake Dr
- 6154 Rockbridge Rd
- 6050 Rockbridge Rd