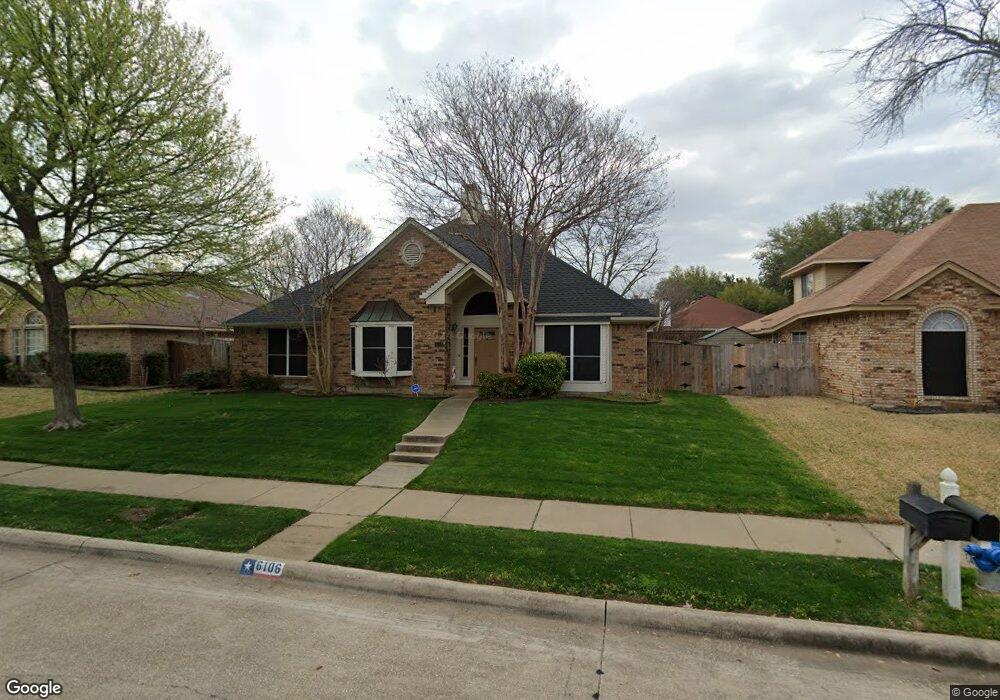
6106 Covington Dr Rowlett, TX 75089
Springfield NeighborhoodEstimated Value: $381,671 - $414,000
4
Beds
2
Baths
2,281
Sq Ft
$172/Sq Ft
Est. Value
About This Home
This home is located at 6106 Covington Dr, Rowlett, TX 75089 and is currently estimated at $393,418, approximately $172 per square foot. 6106 Covington Dr is a home located in Dallas County with nearby schools including Harmony School of Innovation - Garland, Wesleyan Christian Academy, and Lake Cities Montessori School.
Ownership History
Date
Name
Owned For
Owner Type
Purchase Details
Closed on
Feb 8, 2018
Sold by
Newman Janis
Bought by
Tilson Melissa and Tilson David Allen
Current Estimated Value
Home Financials for this Owner
Home Financials are based on the most recent Mortgage that was taken out on this home.
Original Mortgage
$242,526
Outstanding Balance
$209,749
Interest Rate
4.87%
Mortgage Type
FHA
Estimated Equity
$183,669
Purchase Details
Closed on
Feb 20, 2006
Sold by
Snody Charlcie V
Bought by
The Billy D & Charlcie V Snody Revocable
Purchase Details
Closed on
Jul 11, 2005
Sold by
The Billy D & Charlcie V Snody Revocable
Bought by
Snody Charlcie
Purchase Details
Closed on
Dec 2, 1997
Sold by
Snody Billy D
Bought by
The Billy D & Charlcie V Snody Revocable
Purchase Details
Closed on
May 19, 1997
Sold by
Delimon Kurt Robert and Delimon Laurene Susan
Bought by
Snody Bill
Create a Home Valuation Report for This Property
The Home Valuation Report is an in-depth analysis detailing your home's value as well as a comparison with similar homes in the area
Home Values in the Area
Average Home Value in this Area
Purchase History
| Date | Buyer | Sale Price | Title Company |
|---|---|---|---|
| Tilson Melissa | -- | Capital Title | |
| The Billy D & Charlcie V Snody Revocable | -- | None Available | |
| Snody Charlcie | -- | -- | |
| The Billy D & Charlcie V Snody Revocable | -- | -- | |
| Snody Bill | -- | -- |
Source: Public Records
Mortgage History
| Date | Status | Borrower | Loan Amount |
|---|---|---|---|
| Open | Tilson Melissa | $242,526 |
Source: Public Records
Tax History Compared to Growth
Tax History
| Year | Tax Paid | Tax Assessment Tax Assessment Total Assessment is a certain percentage of the fair market value that is determined by local assessors to be the total taxable value of land and additions on the property. | Land | Improvement |
|---|---|---|---|---|
| 2025 | $6,646 | $393,230 | $80,000 | $313,230 |
| 2024 | $6,646 | $393,230 | $80,000 | $313,230 |
| 2023 | $6,646 | $390,160 | $80,000 | $310,160 |
| 2022 | $8,045 | $332,020 | $80,000 | $252,020 |
| 2021 | $6,770 | $258,630 | $48,000 | $210,630 |
| 2020 | $6,831 | $258,630 | $48,000 | $210,630 |
| 2019 | $6,783 | $236,030 | $40,000 | $196,030 |
| 2018 | $6,830 | $236,030 | $40,000 | $196,030 |
| 2017 | $6,082 | $209,580 | $40,000 | $169,580 |
| 2016 | $5,699 | $196,400 | $30,000 | $166,400 |
| 2015 | $1,843 | $151,820 | $30,000 | $121,820 |
| 2014 | $1,843 | $138,200 | $30,000 | $108,200 |
Source: Public Records
Map
Nearby Homes
- 1501 Patty Cir
- 5909 Brookline Dr
- 5806 Beacon Dr
- 5702 Antioch Dr
- 2221 Petunia Ln
- 2314 Marigold Dr
- 6510 White Oak Dr
- 6518 Teresa Ln
- 2001 Maggis Meadow Ln
- 7013 Tremont Ln
- 6718 Livingstone St
- 1709 Northampton Dr
- 6110 Tacoma St
- 6826 Conestoga Dr
- 6913 Brandford Rd
- 6306 Debbie Cir
- 6617 Stamps St
- 7005 Buckhorn Dr
- 4510 Dexham Rd
- 7214 Deerfield Dr
- 6110 Covington Dr
- 6102 Covington Dr
- 1409 Columbus Dr
- 6114 Covington Dr
- 6105 Covington Dr
- 1413 Columbus Dr
- 6105 Kittyhawk Dr
- 6101 Covington Dr
- 6109 Kittyhawk Dr
- 6118 Covington Dr
- 6113 Covington Dr
- 1402 Columbus Dr
- 1406 Columbus Dr
- 6113 Kittyhawk Dr
- 1417 Columbus Dr
- 1410 Columbus Dr
- 6117 Covington Dr
- 6202 Covington Dr
- 6013 Covington Dr
- 6117 Kittyhawk Dr