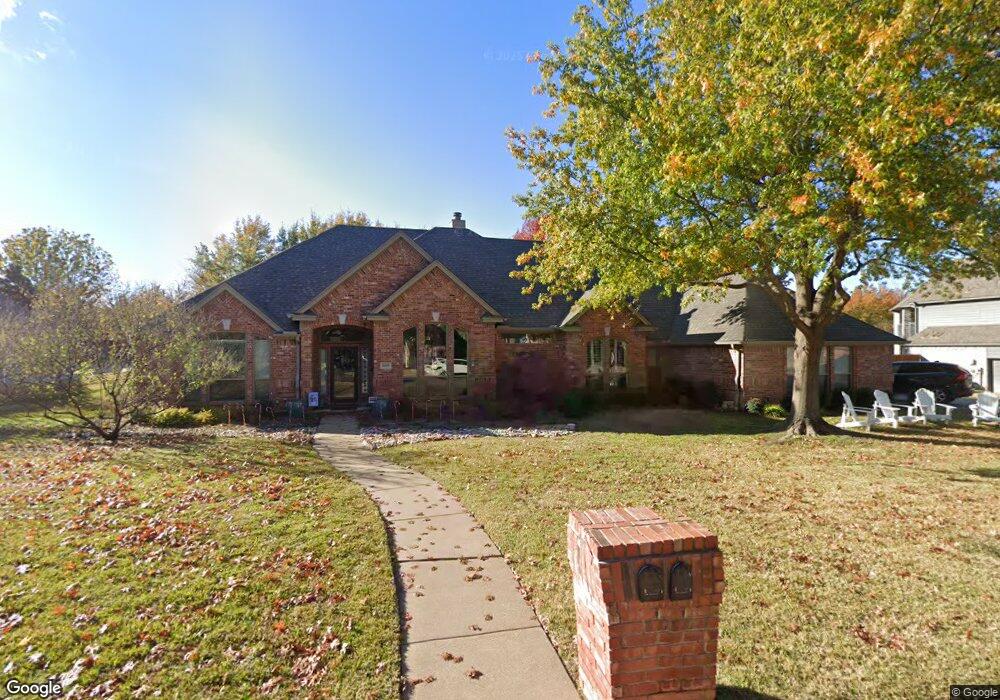
6106 Highland Hills Ln Colleyville, TX 76034
Estimated Value: $871,184 - $963,000
4
Beds
3
Baths
3,224
Sq Ft
$282/Sq Ft
Est. Value
About This Home
This home is located at 6106 Highland Hills Ln, Colleyville, TX 76034 and is currently estimated at $910,296, approximately $282 per square foot. 6106 Highland Hills Ln is a home located in Tarrant County with nearby schools including Glenhope Elementary School, Cross Timbers Middle School, and Grapevine High School.
Ownership History
Date
Name
Owned For
Owner Type
Purchase Details
Closed on
Nov 6, 2018
Sold by
Grassi Jaime Wiseman
Bought by
Jordan Walter and Jordan Kim
Current Estimated Value
Purchase Details
Closed on
Nov 5, 2018
Sold by
Grassi Alexander
Bought by
Grassi Jaime Wiseman
Purchase Details
Closed on
Nov 4, 2016
Sold by
Grassi Alexander
Bought by
Grassi Jaime Wisceman
Purchase Details
Closed on
Oct 28, 2014
Sold by
Baker Sharon Allison and Baker Treadway Rebecca Lane
Bought by
Grassi Jaime Wiseman and Grassi Alexander
Home Financials for this Owner
Home Financials are based on the most recent Mortgage that was taken out on this home.
Original Mortgage
$356,000
Interest Rate
4.25%
Mortgage Type
New Conventional
Purchase Details
Closed on
Mar 10, 1995
Sold by
Hackett William E and Hackett Joy E
Bought by
Baker Edward Lee and Baker Doris Broadway
Create a Home Valuation Report for This Property
The Home Valuation Report is an in-depth analysis detailing your home's value as well as a comparison with similar homes in the area
Home Values in the Area
Average Home Value in this Area
Purchase History
| Date | Buyer | Sale Price | Title Company |
|---|---|---|---|
| Jordan Walter | -- | None Available | |
| Grassi Jaime Wiseman | -- | None Available | |
| Grassi Jaime Wisceman | -- | None Available | |
| Grassi Jaime Wiseman | -- | Allegiance Title | |
| Baker Edward Lee | -- | First American Title Co |
Source: Public Records
Mortgage History
| Date | Status | Borrower | Loan Amount |
|---|---|---|---|
| Previous Owner | Grassi Jaime Wiseman | $356,000 |
Source: Public Records
Tax History Compared to Growth
Tax History
| Year | Tax Paid | Tax Assessment Tax Assessment Total Assessment is a certain percentage of the fair market value that is determined by local assessors to be the total taxable value of land and additions on the property. | Land | Improvement |
|---|---|---|---|---|
| 2025 | $2,716 | $636,000 | $229,600 | $406,400 |
| 2024 | $2,716 | $667,140 | $229,600 | $437,540 |
| 2023 | $12,062 | $769,149 | $229,600 | $539,549 |
| 2022 | $12,839 | $707,174 | $229,600 | $477,574 |
| 2021 | $12,978 | $590,955 | $115,000 | $475,955 |
| 2020 | $12,237 | $550,680 | $115,000 | $435,680 |
| 2019 | $12,732 | $550,680 | $115,000 | $435,680 |
| 2018 | $3,063 | $515,233 | $115,000 | $400,233 |
| 2017 | $12,105 | $512,376 | $105,000 | $407,376 |
| 2016 | $11,380 | $481,704 | $105,000 | $376,704 |
| 2015 | $9,397 | $445,000 | $40,000 | $405,000 |
| 2014 | $9,397 | $405,500 | $40,000 | $365,500 |
Source: Public Records
Map
Nearby Homes
- 2008 Kyle Ct
- 1813 Grosvenor Green
- 1509 Tinker Rd
- 5613 Versailles Ct
- 2602 Pointe Ct
- 1315 Hardage Ln
- 2618 Pointe Ct
- 5508 Coventry Ct
- 5504 Sycamore Dr
- Lot 4 Amelia Ct
- 6005 Valentino Ct
- 7001 Colleyville Blvd
- 2406 Wilkes Dr
- 5404 Miramar Ln
- 3589 Boxwood Dr
- 5317 Bluebonnet Dr
- 7208 Stilton Ct
- 1512 Four Seasons Dr
- 6805 Shalimar Ct
- 3206 Wintergreen Terrace
- 6108 Highland Hills Ln
- 6104 Highland Hills Ln
- 6201 Burnham Cir
- 6107 Highland Hills Ln
- 6200 Highland Hills Ln
- 6109 Highland Hills Ln
- 6105 Highland Hills Ln
- 6102 Highland Hills Ln
- 6202 Highland Hills Ln
- 6201 Highland Hills Ln
- 6103 Highland Hills Ln
- 6200 Burnham Cir
- 6208 Burnham Cir
- 6204 Burnham Cir
- 2101 High Gate Dr
- 2100 Highland Meadow Dr
- 6210 Burnham Cir
- 6100 Highland Hills Ln
- 6108 Burnham Cir
- 6212 Burnham Cir