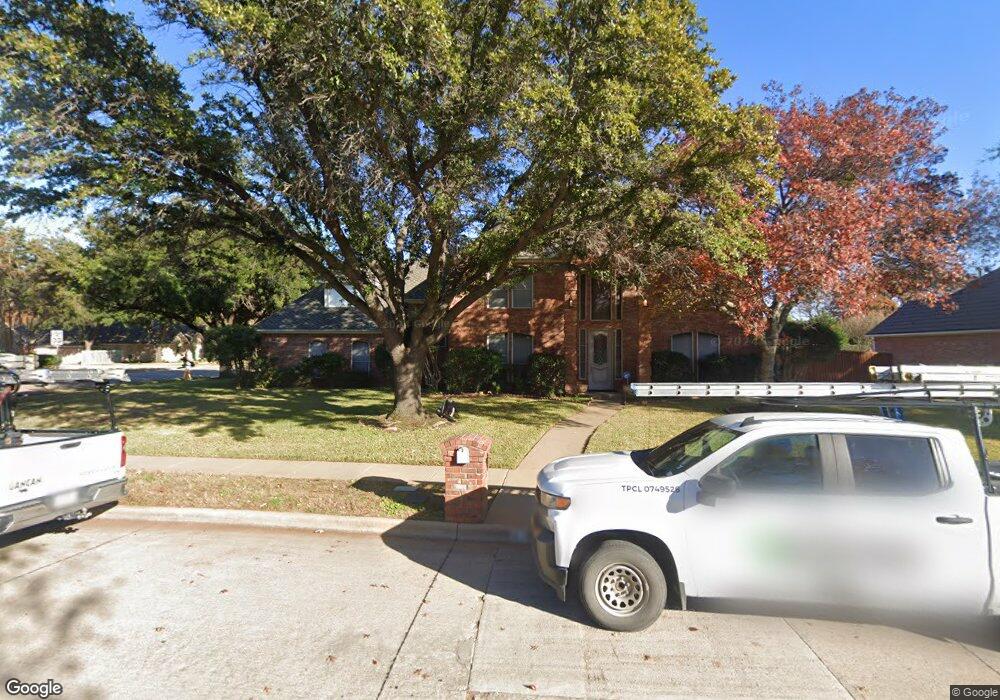
6107 Hillbrook Dr Colleyville, TX 76034
Estimated Value: $926,394 - $997,000
4
Beds
3
Baths
3,283
Sq Ft
$292/Sq Ft
Est. Value
About This Home
This home is located at 6107 Hillbrook Dr, Colleyville, TX 76034 and is currently estimated at $957,099, approximately $291 per square foot. 6107 Hillbrook Dr is a home located in Tarrant County with nearby schools including Glenhope Elementary School, Cross Timbers Middle School, and Grapevine High School.
Ownership History
Date
Name
Owned For
Owner Type
Purchase Details
Closed on
Jul 30, 2003
Sold by
Bebermeyer Nichole and Bebermeyer Roy
Bought by
Chukwu Anthony N
Current Estimated Value
Purchase Details
Closed on
Dec 14, 2000
Sold by
Bacon Thomas F and Bacon Laura C
Bought by
Colbert Nichole and Bebermeyer Roy
Home Financials for this Owner
Home Financials are based on the most recent Mortgage that was taken out on this home.
Original Mortgage
$220,000
Interest Rate
7.8%
Purchase Details
Closed on
Jan 28, 2000
Sold by
Raw Inc
Bought by
Bacon Thomas F and Bacon Laura C
Home Financials for this Owner
Home Financials are based on the most recent Mortgage that was taken out on this home.
Original Mortgage
$75,000
Interest Rate
7.95%
Create a Home Valuation Report for This Property
The Home Valuation Report is an in-depth analysis detailing your home's value as well as a comparison with similar homes in the area
Home Values in the Area
Average Home Value in this Area
Purchase History
| Date | Buyer | Sale Price | Title Company |
|---|---|---|---|
| Chukwu Anthony N | -- | Alamo Title Company | |
| Colbert Nichole | -- | First American Title Co | |
| Bacon Thomas F | -- | American Title |
Source: Public Records
Mortgage History
| Date | Status | Borrower | Loan Amount |
|---|---|---|---|
| Previous Owner | Colbert Nichole | $220,000 | |
| Previous Owner | Bacon Thomas F | $75,000 | |
| Closed | Colbert Nichole | $27,500 |
Source: Public Records
Tax History Compared to Growth
Tax History
| Year | Tax Paid | Tax Assessment Tax Assessment Total Assessment is a certain percentage of the fair market value that is determined by local assessors to be the total taxable value of land and additions on the property. | Land | Improvement |
|---|---|---|---|---|
| 2025 | $3,683 | $763,715 | $231,700 | $532,015 |
| 2024 | $3,683 | $763,715 | $231,700 | $532,015 |
| 2023 | $13,078 | $775,263 | $231,700 | $543,563 |
| 2022 | $14,079 | $712,874 | $231,700 | $481,174 |
| 2021 | $13,057 | $594,563 | $115,000 | $479,563 |
| 2020 | $12,363 | $556,360 | $115,000 | $441,360 |
| 2019 | $12,937 | $559,563 | $115,000 | $444,563 |
| 2018 | $3,079 | $517,993 | $115,000 | $402,993 |
| 2017 | $11,833 | $500,857 | $105,000 | $395,857 |
| 2016 | $10,994 | $465,343 | $105,000 | $360,343 |
| 2015 | $9,427 | $488,050 | $40,000 | $448,050 |
| 2014 | $9,427 | $406,800 | $40,000 | $366,800 |
Source: Public Records
Map
Nearby Homes
- 2618 Pointe Ct
- 2602 Pointe Ct
- 2008 Kyle Ct
- 3589 Boxwood Dr
- 5504 Sycamore Dr
- 3223 Wintergreen Terrace
- 1813 Grosvenor Green
- 3206 Wintergreen Terrace
- 5613 Versailles Ct
- 2406 Wilkes Dr
- 3904 Wagon Wheel Dr
- 3107 Wintergreen Terrace
- 3329 Moss Creek Dr
- 5404 Miramar Ln
- 3053 Sentinal Butte
- 2906 Cottonwood Ln
- 4214 Hearthside Dr
- 4213 Hearthside Dr
- 1509 Tinker Rd
- 3052 Ridgeview Dr
- 6105 Hillbrook Dr
- 2505 Highland Meadow Dr
- 2505 Highland Dr
- 2405 Highland Meadow Dr
- 2502 Highland Meadow Dr
- 6103 Hillbrook Dr
- 2406 Highland Meadow Dr
- 2504 Highland Dr
- 2504 Highland Meadow Dr
- 6104 Hillbrook Dr
- 2507 Highland Meadow Dr
- 2403 Highland Meadow Dr
- 2404 Highland Meadow Dr
- 6101 Hillbrook Dr
- 2506 Highland Meadow Dr
- 6102 Hillbrook Dr
- 2503 Heather Glenn Ct
- 2501 Heather Glenn Ct
- 2505 Heather Glenn Ct
- 2500 Highland Park Ct