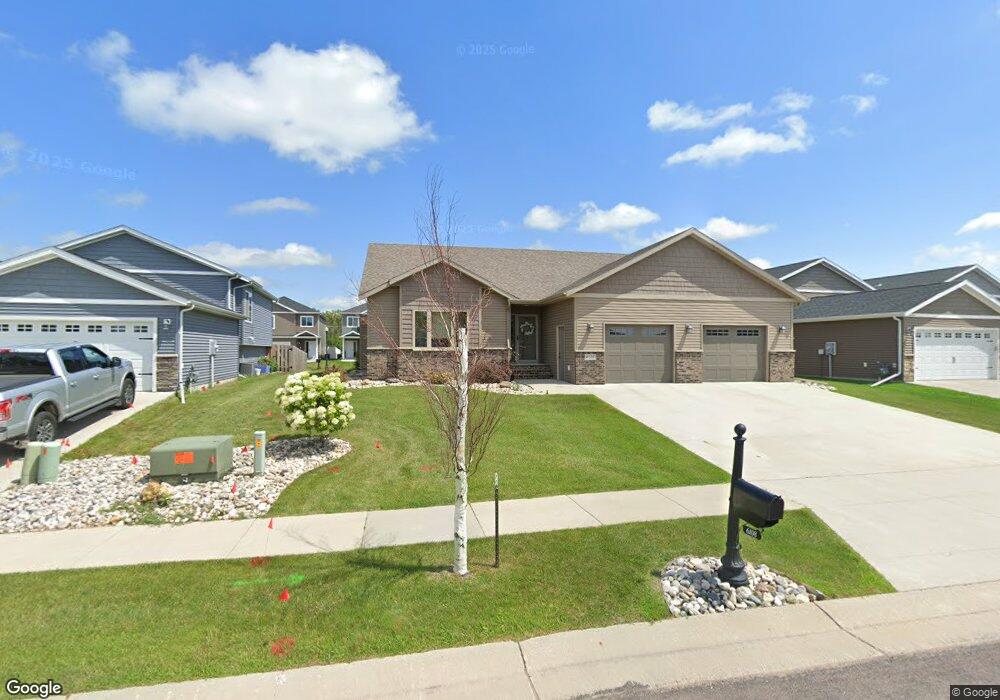
6108 14th St S Fargo, ND 58104
Bennett NeighborhoodEstimated Value: $384,000 - $519,000
4
Beds
3
Baths
3,214
Sq Ft
$146/Sq Ft
Est. Value
About This Home
This home is located at 6108 14th St S, Fargo, ND 58104 and is currently estimated at $470,669, approximately $146 per square foot. 6108 14th St S is a home located in Cass County with nearby schools including Bennett Elementary School, Discovery Middle School, and Fargo Davies High School.
Ownership History
Date
Name
Owned For
Owner Type
Purchase Details
Closed on
Jun 1, 2016
Sold by
Estenson Michael D and Estenson Patricia M
Bought by
Burke Wade J and Burke Sheila M
Current Estimated Value
Home Financials for this Owner
Home Financials are based on the most recent Mortgage that was taken out on this home.
Original Mortgage
$235,000
Outstanding Balance
$105,244
Interest Rate
3.59%
Mortgage Type
New Conventional
Estimated Equity
$365,426
Purchase Details
Closed on
Sep 16, 2013
Sold by
Rose Creek Development Corp
Bought by
Estenson Michael D and Estenson Patricia M
Create a Home Valuation Report for This Property
The Home Valuation Report is an in-depth analysis detailing your home's value as well as a comparison with similar homes in the area
Home Values in the Area
Average Home Value in this Area
Purchase History
| Date | Buyer | Sale Price | Title Company |
|---|---|---|---|
| Burke Wade J | $359,800 | None Available | |
| Estenson Michael D | $32,900 | None Available |
Source: Public Records
Mortgage History
| Date | Status | Borrower | Loan Amount |
|---|---|---|---|
| Open | Burke Wade J | $235,000 |
Source: Public Records
Tax History Compared to Growth
Tax History
| Year | Tax Paid | Tax Assessment Tax Assessment Total Assessment is a certain percentage of the fair market value that is determined by local assessors to be the total taxable value of land and additions on the property. | Land | Improvement |
|---|---|---|---|---|
| 2024 | $7,416 | $224,650 | $35,550 | $189,100 |
| 2023 | $7,709 | $218,100 | $35,550 | $182,550 |
| 2022 | $7,485 | $210,250 | $37,450 | $172,800 |
| 2021 | $6,872 | $191,150 | $37,450 | $153,700 |
| 2020 | $6,630 | $191,150 | $37,450 | $153,700 |
| 2019 | $6,636 | $191,150 | $23,400 | $167,750 |
| 2018 | $7,677 | $191,150 | $23,400 | $167,750 |
| 2017 | $7,540 | $191,150 | $23,400 | $167,750 |
| 2016 | $7,139 | $188,800 | $23,400 | $165,400 |
| 2015 | $5,182 | $96,650 | $15,900 | $80,750 |
| 2014 | $6,912 | $158,950 | $15,900 | $143,050 |
| 2013 | $3,166 | $11,150 | $11,150 | $0 |
Source: Public Records
Map
Nearby Homes