Estimated Value: $195,000 - $250,000
3
Beds
1
Bath
975
Sq Ft
$240/Sq Ft
Est. Value
About This Home
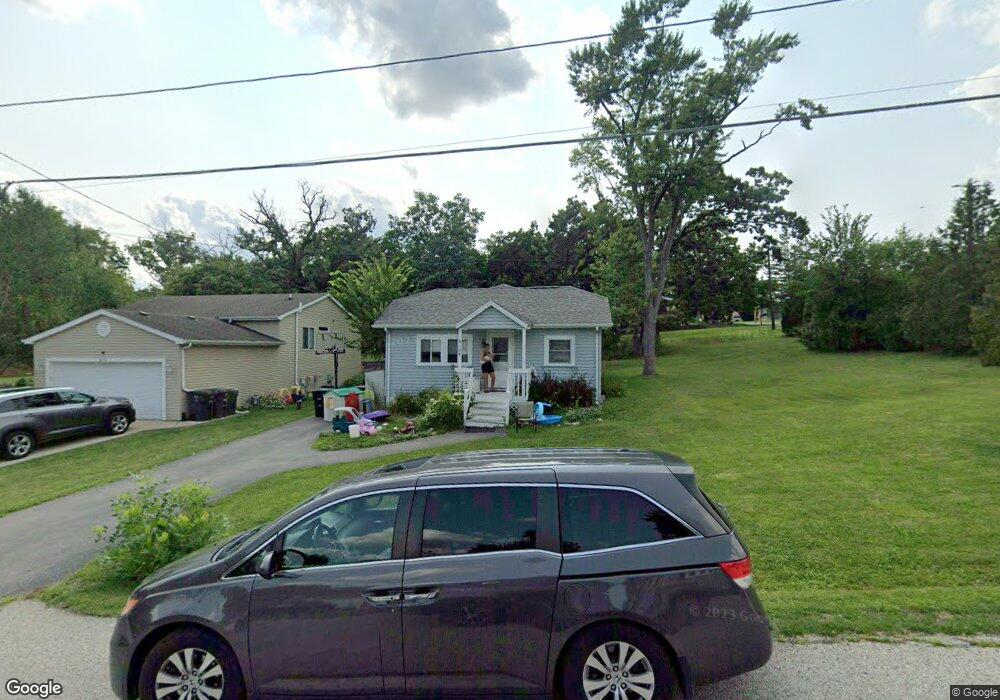
This home is located at 6108 241st Ave, Salem, WI 53168 and is currently estimated at $233,700, approximately $239 per square foot. 6108 241st Ave is a home located in Kenosha County with nearby schools including Salem Elementary School and Central High School.
Ownership History
Date
Name
Owned For
Owner Type
Purchase Details
Closed on
Sep 9, 2015
Sold by
Lesniak Kimberly A and Schmitt Kimberly A
Bought by
Waldenstrom Kevin
Current Estimated Value
Purchase Details
Closed on
Apr 11, 2014
Sold by
Lesniak Donald L
Bought by
Lesniak Kimberly A
Purchase Details
Closed on
May 24, 2013
Sold by
Lesniak Donald L
Bought by
Lesniak Kimberly A
Purchase Details
Closed on
Nov 23, 2011
Sold by
Lindas Justin E
Bought by
Lesniak Donald L and Lesniak Kimberly A
Purchase Details
Closed on
Oct 29, 2010
Sold by
Chase Home Finance Llc
Bought by
Sec Of Housing & Urban Development
Purchase Details
Closed on
Sep 8, 2010
Sold by
Ganzer Andrew P
Bought by
Chase Home Finance Llc Suc By Merger Wit
Create a Home Valuation Report for This Property
The Home Valuation Report is an in-depth analysis detailing your home's value as well as a comparison with similar homes in the area
Home Values in the Area
Average Home Value in this Area
Purchase History
| Date | Buyer | Sale Price | Title Company |
|---|---|---|---|
| Waldenstrom Kevin | $89,900 | -- | |
| Lesniak Kimberly A | $126,000 | -- | |
| Lesniak Kimberly A | -- | -- | |
| Lesniak Donald L | $125,000 | -- | |
| Sec Of Housing & Urban Development | $95,600 | -- | |
| Chase Home Finance Llc Suc By Merger Wit | $95,600 | -- |
Source: Public Records
Tax History Compared to Growth
Tax History
| Year | Tax Paid | Tax Assessment Tax Assessment Total Assessment is a certain percentage of the fair market value that is determined by local assessors to be the total taxable value of land and additions on the property. | Land | Improvement |
|---|---|---|---|---|
| 2024 | $2,571 | $173,500 | $49,000 | $124,500 |
| 2023 | $2,225 | $173,500 | $49,000 | $124,500 |
| 2022 | $2,740 | $155,000 | $39,000 | $116,000 |
| 2021 | $2,759 | $155,000 | $39,000 | $116,000 |
| 2020 | $2,759 | $134,100 | $25,500 | $108,600 |
| 2019 | $2,751 | $134,100 | $25,500 | $108,600 |
| 2018 | $3,078 | $134,100 | $25,500 | $108,600 |
| 2017 | $2,801 | $121,600 | $25,500 | $96,100 |
| 2016 | $3,179 | $121,600 | $25,500 | $96,100 |
| 2015 | $2,777 | $121,600 | $25,500 | $96,100 |
| 2014 | $2,968 | $121,600 | $25,500 | $96,100 |
Source: Public Records
Map
Nearby Homes