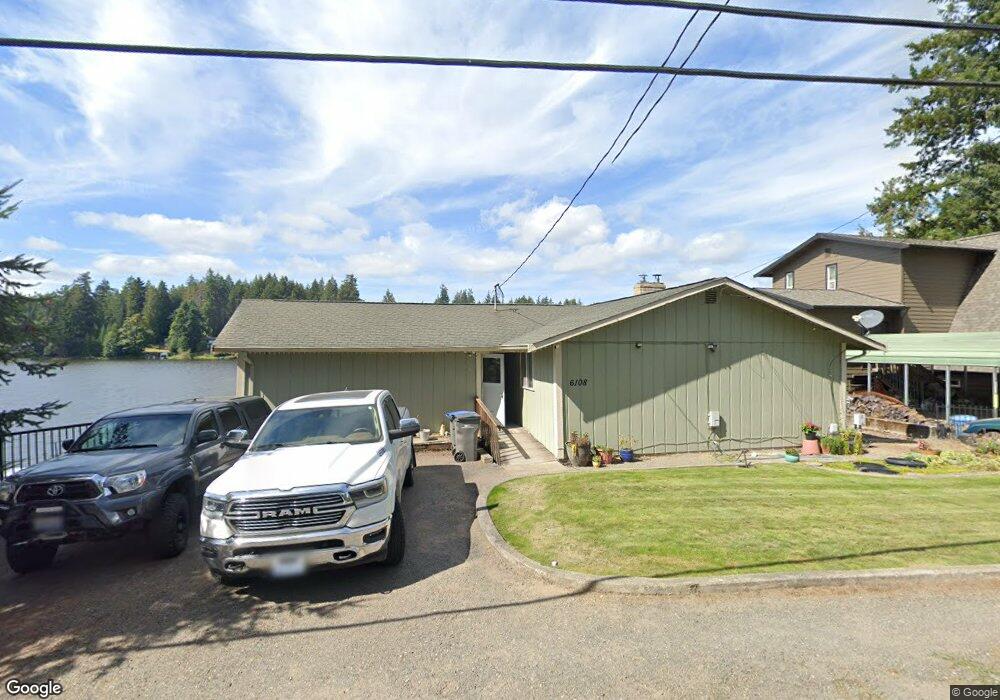
6108 Long Lake Rd SE Port Orchard, WA 98367
Estimated Value: $656,000 - $746,000
2
Beds
2
Baths
1,429
Sq Ft
$488/Sq Ft
Est. Value
About This Home
This home is located at 6108 Long Lake Rd SE, Port Orchard, WA 98367 and is currently estimated at $697,163, approximately $487 per square foot. 6108 Long Lake Rd SE is a home located in Kitsap County with nearby schools including Mullenix Ridge Elementary School, John Sedgwick Middle School, and South Kitsap High School.
Ownership History
Date
Name
Owned For
Owner Type
Purchase Details
Closed on
Jan 31, 2007
Sold by
Watts Calvin W and Lafountaine Kristen P
Bought by
Watts Calvin W and Lafountaine Kristen P
Current Estimated Value
Purchase Details
Closed on
Sep 8, 2003
Sold by
Loop Herbert E
Bought by
Watts Calvin W and Lafountaine Kristen P
Home Financials for this Owner
Home Financials are based on the most recent Mortgage that was taken out on this home.
Original Mortgage
$250,000
Interest Rate
3.75%
Mortgage Type
Unknown
Purchase Details
Closed on
Aug 29, 2003
Sold by
Loop Herbert E
Bought by
Lavigne Vernon L and Lavigne Pamela J
Home Financials for this Owner
Home Financials are based on the most recent Mortgage that was taken out on this home.
Original Mortgage
$250,000
Interest Rate
3.75%
Mortgage Type
Unknown
Purchase Details
Closed on
Nov 21, 2000
Sold by
Loop Herbert E
Bought by
Loop Herbert E
Create a Home Valuation Report for This Property
The Home Valuation Report is an in-depth analysis detailing your home's value as well as a comparison with similar homes in the area
Home Values in the Area
Average Home Value in this Area
Purchase History
| Date | Buyer | Sale Price | Title Company |
|---|---|---|---|
| Watts Calvin W | -- | First American Title Ins Co | |
| Watts Calvin W | $280,000 | Pacific Nw Title | |
| Lavigne Vernon L | -- | -- | |
| Loop Herbert E | -- | Pacific Nw Title |
Source: Public Records
Mortgage History
| Date | Status | Borrower | Loan Amount |
|---|---|---|---|
| Previous Owner | Watts Calvin W | $250,000 |
Source: Public Records
Tax History Compared to Growth
Tax History
| Year | Tax Paid | Tax Assessment Tax Assessment Total Assessment is a certain percentage of the fair market value that is determined by local assessors to be the total taxable value of land and additions on the property. | Land | Improvement |
|---|---|---|---|---|
| 2026 | $5,658 | $665,750 | $218,810 | $446,940 |
| 2025 | $5,658 | $665,750 | $218,810 | $446,940 |
| 2024 | $5,484 | $665,750 | $218,810 | $446,940 |
| 2023 | $5,445 | $665,750 | $218,810 | $446,940 |
| 2022 | $4,987 | $509,720 | $175,040 | $334,680 |
| 2021 | $4,648 | $449,530 | $156,290 | $293,240 |
| 2020 | $4,553 | $428,150 | $145,490 | $282,660 |
| 2019 | $3,708 | $383,870 | $134,930 | $248,940 |
| 2018 | $4,070 | $353,900 | $134,930 | $218,970 |
| 2017 | $3,748 | $353,900 | $134,930 | $218,970 |
| 2016 | $3,438 | $296,340 | $117,330 | $179,010 |
| 2015 | $3,347 | $292,600 | $117,330 | $175,270 |
| 2014 | -- | $284,950 | $91,190 | $193,760 |
| 2013 | -- | $259,250 | $81,970 | $177,280 |
Source: Public Records
Map
Nearby Homes
- 4646 SE Green Shores Dr
- 6814 Darla Ln SE
- 6223 Ebbert Dr SE
- 5544 Clover Valley Rd SE
- 5159 Country Club Way SE
- 7443 Clover Valley Rd SE
- 6685 Skipper Ln SE
- 5310 SE Sedgwick Rd
- 6498 Skipper Ln SE
- 4141 SW Muller Ln
- 0 Long Lake Rd SE Unit NWM2439154
- 0 Long Lake Rd SE Unit NWM2354075
- 3371 SE Bielmeier Rd Unit 85
- 3371 SE Bielmeier Rd Unit 47
- 3371 SE Bielmeier Rd Unit 26
- 3371 SE Bielmeier Rd Unit 91
- 3371 SE Bielmeier Rd Unit 79
- 3371 SE Bielmeier Rd Unit 80
- 3371 SE Bielmeier Rd Unit 95
- 3371 SE Bielmeier Rd Unit 33A
- 6098 Long Lake Rd SE
- 4901 SE Gillio Ct
- 6125 Long Lake Rd SE
- 6175 Long Lake Rd SE
- 6116 Eliot Place SE
- 4906 SE Gillio Ct
- 6171 Long Lake Rd SE
- 6171 Long Lake Rd SE
- 6124 Eliot Place SE
- 6371 Long Lake Rd SE
- 5016 SE Safe Haven Way
- 6298 Long Lake Rd SE
- 4917 SE Gillio Ct
- 5004 SE Haven Way N
- 6115 Eliot Place SE
- 4918 SE Gillio Ct
- 6401 Long Lake Rd SE
- 5004 SE Safe Haven Way
- 5004 SE Safe Haven Way