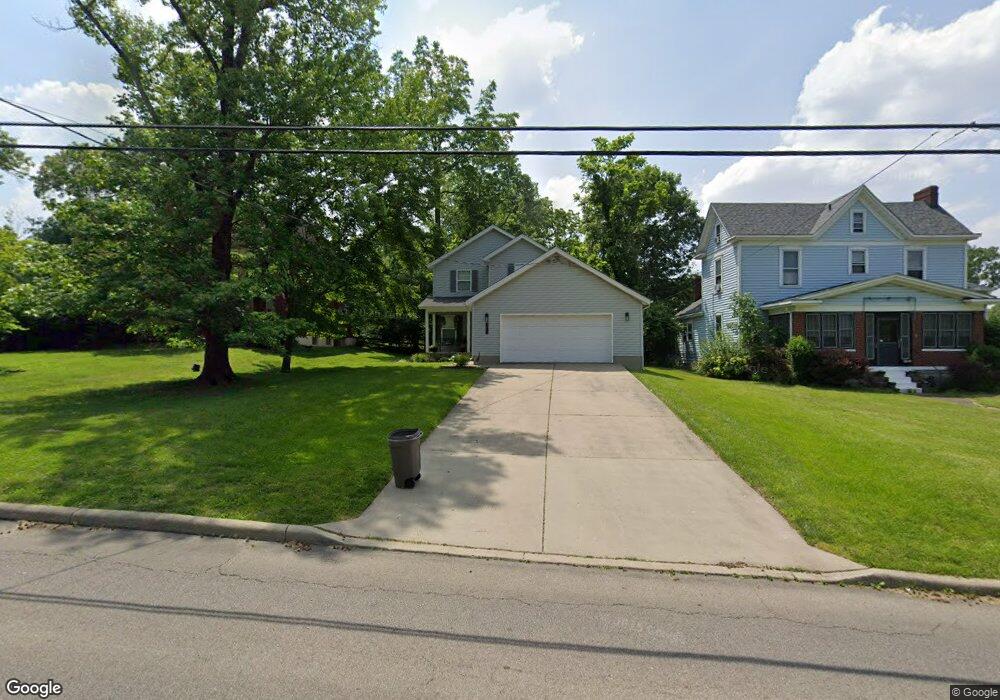
6109 Plainfield Rd Cincinnati, OH 45213
Estimated Value: $290,207 - $331,000
3
Beds
3
Baths
1,296
Sq Ft
$247/Sq Ft
Est. Value
About This Home
This home is located at 6109 Plainfield Rd, Cincinnati, OH 45213 and is currently estimated at $319,802, approximately $246 per square foot. 6109 Plainfield Rd is a home located in Hamilton County with nearby schools including Silverton Paideia Elementary School, Shroder High School, and Clark Montessori High School.
Ownership History
Date
Name
Owned For
Owner Type
Purchase Details
Closed on
Aug 1, 1995
Sold by
Shavers Joyce Yvette and Shavers James Rudolph
Bought by
Johnson Labraune W and Johnson Jacqueline K
Current Estimated Value
Home Financials for this Owner
Home Financials are based on the most recent Mortgage that was taken out on this home.
Original Mortgage
$74,100
Interest Rate
7.56%
Purchase Details
Closed on
Jul 31, 1995
Sold by
Gammarino Al and Brenner Stephen J
Bought by
Shavers Joyce Yvette and Shavers Ii James Rudolph
Home Financials for this Owner
Home Financials are based on the most recent Mortgage that was taken out on this home.
Original Mortgage
$74,100
Interest Rate
7.56%
Create a Home Valuation Report for This Property
The Home Valuation Report is an in-depth analysis detailing your home's value as well as a comparison with similar homes in the area
Home Values in the Area
Average Home Value in this Area
Purchase History
| Date | Buyer | Sale Price | Title Company |
|---|---|---|---|
| Johnson Labraune W | -- | -- | |
| Shavers Joyce Yvette | -- | -- |
Source: Public Records
Mortgage History
| Date | Status | Borrower | Loan Amount |
|---|---|---|---|
| Closed | Johnson Labraune W | $74,100 |
Source: Public Records
Tax History Compared to Growth
Tax History
| Year | Tax Paid | Tax Assessment Tax Assessment Total Assessment is a certain percentage of the fair market value that is determined by local assessors to be the total taxable value of land and additions on the property. | Land | Improvement |
|---|---|---|---|---|
| 2024 | $4,106 | $71,933 | $8,642 | $63,291 |
| 2023 | $4,198 | $71,933 | $8,642 | $63,291 |
| 2022 | $3,515 | $50,953 | $6,328 | $44,625 |
| 2021 | $3,423 | $50,953 | $6,328 | $44,625 |
| 2020 | $3,477 | $50,953 | $6,328 | $44,625 |
| 2019 | $3,511 | $46,323 | $5,754 | $40,569 |
| 2018 | $3,517 | $46,323 | $5,754 | $40,569 |
| 2017 | $3,359 | $46,323 | $5,754 | $40,569 |
| 2016 | $3,446 | $46,649 | $5,289 | $41,360 |
| 2015 | $3,117 | $46,649 | $5,289 | $41,360 |
| 2014 | $3,136 | $46,649 | $5,289 | $41,360 |
| 2013 | $3,749 | $54,880 | $6,223 | $48,657 |
Source: Public Records
Map
Nearby Homes
- 3969 S Fordham Place
- 3962 S Fordham Place
- 3946 Cedarwood Place
- 6097 W Fordham Place
- 6124 Hedge Ave
- 3942 Standish Ave
- 3824 Standish Ave
- 3751 Dunloe Ave
- 57 Red Bank Rd
- 6240 Red Bank Rd
- 6063 Woodford Ct
- 6414 Red Bank Rd
- 6535 Highland Ave
- 6133 Red Bank Rd
- 3766 Aikenside Ave
- 3849 Oak Crest Ave
- 5800 Cherokee Dr
- 6502 Coleridge Ave
- 3813 Congreve Ave
- 3635 Northdale Place
- 6111 Plainfield Rd
- 6105 Plainfield Rd
- 6115 Plainfield Rd
- 3973 S Fordham Place
- 6106 Plainfield Rd
- 3965 S Fordham Place
- 6031 Plainfield Rd
- 6110 Plainfield Rd
- 3961 S Fordham Place
- 6102 Plainfield Rd
- 6104 Plainfield Rd
- 6112 Plainfield Rd
- 6027 Plainfield Rd
- 3957 S Fordham Place
- 3957 N Fordham Place
- 6100 Plainfield Rd
- 3982 S Fordham Place
- 3978 S Fordham Place
- 3974 S Fordham Place
- 3970 S Fordham Place