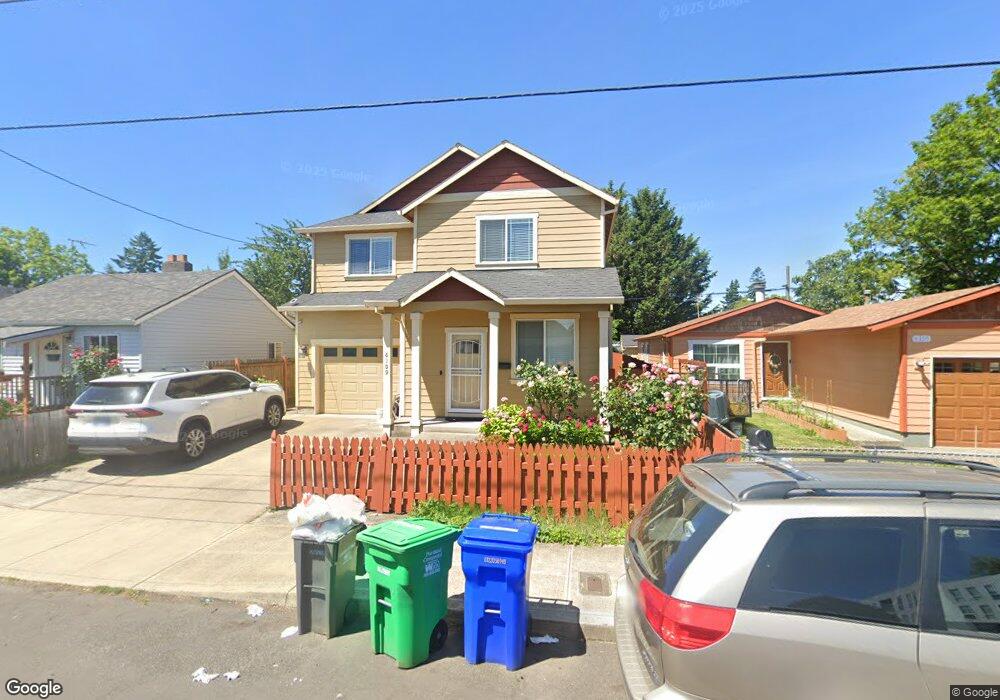
6109 SE 84th Ave Portland, OR 97266
Lents NeighborhoodEstimated Value: $464,000 - $537,000
4
Beds
3
Baths
1,759
Sq Ft
$282/Sq Ft
Est. Value
About This Home
This home is located at 6109 SE 84th Ave, Portland, OR 97266 and is currently estimated at $495,360, approximately $281 per square foot. 6109 SE 84th Ave is a home located in Multnomah County with nearby schools including Woodmere Elementary School, Lane Middle School, and Franklin High School.
Ownership History
Date
Name
Owned For
Owner Type
Purchase Details
Closed on
Jan 11, 2013
Sold by
Koopman Jeff
Bought by
Liang Hui Jing and He Changwen
Current Estimated Value
Home Financials for this Owner
Home Financials are based on the most recent Mortgage that was taken out on this home.
Original Mortgage
$171,000
Outstanding Balance
$118,339
Interest Rate
3.27%
Mortgage Type
New Conventional
Estimated Equity
$377,021
Purchase Details
Closed on
May 2, 2012
Sold by
Pellegrini Teri
Bought by
Koopman Jeff
Purchase Details
Closed on
Jan 25, 2012
Sold by
Federal National Mortgage Association
Bought by
Pellegrini Teri
Purchase Details
Closed on
Oct 25, 2011
Sold by
Payne Don and Payne Marilyn
Bought by
Federal National Mortgage Association
Purchase Details
Closed on
Feb 10, 1997
Sold by
Hibdon Bill and Hibdon Alma
Bought by
Payne Don and Payne Marilyn
Create a Home Valuation Report for This Property
The Home Valuation Report is an in-depth analysis detailing your home's value as well as a comparison with similar homes in the area
Home Values in the Area
Average Home Value in this Area
Purchase History
| Date | Buyer | Sale Price | Title Company |
|---|---|---|---|
| Liang Hui Jing | $242,000 | First American | |
| Koopman Jeff | $71,600 | First American | |
| Pellegrini Teri | $63,000 | Chicago Title Insurance Co | |
| Federal National Mortgage Association | $141,355 | None Available | |
| Payne Don | $15,816 | Fidelity National Title | |
| Hibdon Billy | $11,348 | Fidelity National Title |
Source: Public Records
Mortgage History
| Date | Status | Borrower | Loan Amount |
|---|---|---|---|
| Open | Liang Hui Jing | $171,000 |
Source: Public Records
Tax History Compared to Growth
Tax History
| Year | Tax Paid | Tax Assessment Tax Assessment Total Assessment is a certain percentage of the fair market value that is determined by local assessors to be the total taxable value of land and additions on the property. | Land | Improvement |
|---|---|---|---|---|
| 2024 | $5,676 | $212,140 | -- | -- |
| 2023 | $5,458 | $205,960 | $0 | $0 |
| 2022 | $1,614 | $60,440 | $0 | $0 |
| 2021 | $1,587 | $58,680 | $0 | $0 |
| 2020 | $1,456 | $56,980 | $0 | $0 |
| 2019 | $1,402 | $55,330 | $0 | $0 |
| 2018 | $1,361 | $53,720 | $0 | $0 |
| 2017 | $1,305 | $52,160 | $0 | $0 |
| 2016 | $1,194 | $50,650 | $0 | $0 |
| 2015 | $1,163 | $49,180 | $0 | $0 |
| 2014 | $1,050 | $47,750 | $0 | $0 |
Source: Public Records
Map
Nearby Homes
- 6024 SE 84th Place
- 6103 SE 83rd Ave
- 5913 SE 86th Ave
- 6126 SE 86th Ave
- 6336 SE 84th Place
- 5724 SE 83rd Ave Unit 5726
- 6331 SE 83rd Ave
- 6131 SE 87th Ave
- 6412 SE 83rd Ave
- 5829 SE 80th Ct Unit 5831
- 5628 SE 87th Ave
- 6524 SE 86th Ave
- 5843 SE 90th Ave
- 6429 SE 80th Place
- 6605 SE 83rd Ave
- 5636 SE 88th Ave
- 6604 SE 86th Ave
- 8819 SE Ellis St Unit 5
- 7822 SE Henry St
- 8413 SE Insley St
- 6111 SE 84th Ave
- 6117 SE 84th Ave
- 6105 SE 84th Ave
- 6105 SE 84th Place
- 6123 SE 84th Ave
- 6101 SE 84th Ave
- 6112 SE 83rd Ave
- 6118 SE 83rd Ave
- 6131 SE 84th Ave
- 6124 SE 83rd Ave
- 6038 SE 83rd Ave
- 6081 SE 84th Place
- 6112 SE 84th Ave
- 6118 SE 84th Ave
- 6201 SE 84th Ave
- 6030 SE 83rd Ave
- 6130 SE 83rd Ave
- 6080 SE 84th Ave
- 6100 SE 84th Ave
- 6122 SE 84th Ave