M
Seller's Agent in 2025
Mike Kane
Raboin Realty
(701) 446-7171
109 Total Sales
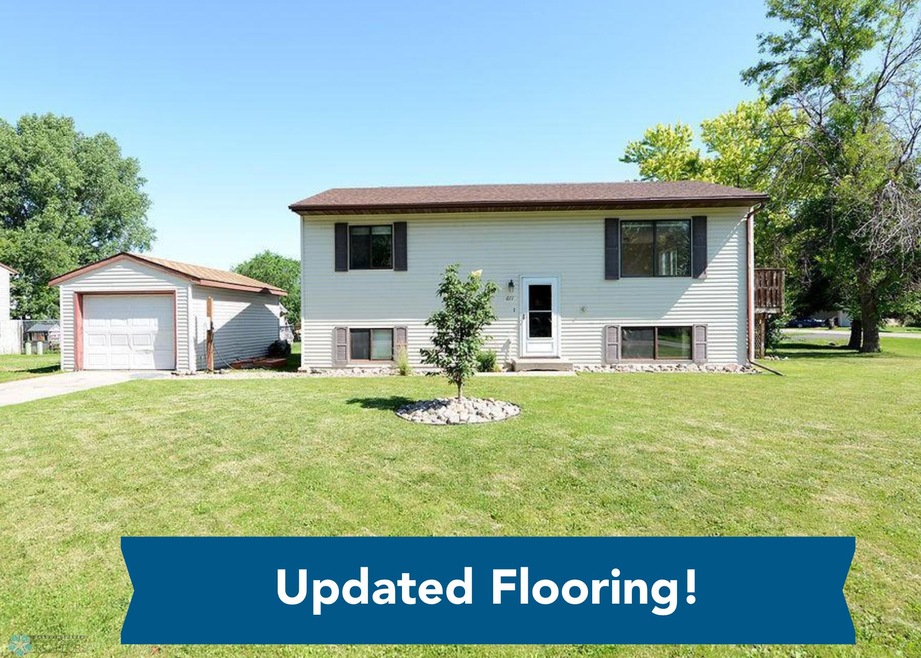


Beautiful 4-Bedroom Home on a Corner Lot in Mapleton, ND
Welcome to this spacious and well-maintained 4-bedroom, 2-bathroom home located on a desirable corner lot in Mapleton, ND. This inviting residence features an open-concept layout that’s perfect for both everyday living and entertaining.
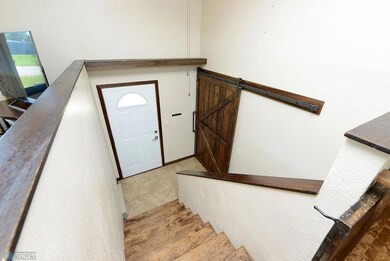
Upstairs, you'll find gorgeous hardwood flooring throughout, adding warmth and character to the living space. The lower level has updated flooring, creating a fresh, comfortable atmosphere for relaxation or gatherings.
The home includes two full bathrooms, one with a stylish tile shower that adds a modern touch. With plenty of natural light and thoughtful design throughout, this property offers both functionality and charm.
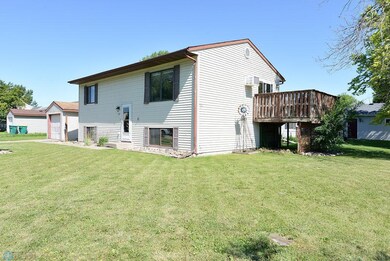
Situated on a corner lot with great curb appeal and outdoor space, this is a wonderful opportunity to enjoy quiet, small-town living with easy access to nearby amenities.
| Date | Type | Sale Price | Title Company |
|---|---|---|---|
| Warranty Deed | $245,900 | Fm Title | |
| Interfamily Deed Transfer | -- | Plains Title Llc | |
| Warranty Deed | $139,000 | None Available | |
| Special Warranty Deed | -- | -- | |
| Sheriffs Deed | $58,650 | -- | |
| Sheriffs Deed | -- | None Available |
| Date | Status | Loan Amount | Loan Type |
|---|---|---|---|
| Open | $233,605 | New Conventional | |
| Previous Owner | $139,000 | New Conventional | |
| Previous Owner | $141,836 | New Conventional |
| Date | Event | Price | List to Sale | Price per Sq Ft |
|---|---|---|---|---|
| 09/12/2025 09/12/25 | Sold | -- | -- | -- |
| 07/21/2025 07/21/25 | Pending | -- | -- | -- |
| 07/07/2025 07/07/25 | For Sale | $245,900 | -- | $135 / Sq Ft |
| Year | Tax Paid | Tax Assessment Tax Assessment Total Assessment is a certain percentage of the fair market value that is determined by local assessors to be the total taxable value of land and additions on the property. | Land | Improvement |
|---|---|---|---|---|
| 2024 | $3,039 | $99,900 | $13,500 | $86,400 |
| 2023 | $3,003 | $100,500 | $13,500 | $87,000 |
| 2022 | $2,596 | $91,950 | $13,500 | $78,450 |
| 2021 | $2,456 | $83,650 | $10,400 | $73,250 |
| 2020 | $2,345 | $81,350 | $10,400 | $70,950 |
| 2019 | $2,325 | $81,350 | $10,400 | $70,950 |
| 2018 | $2,349 | $81,350 | $10,400 | $70,950 |
| 2017 | $2,237 | $80,550 | $10,400 | $70,150 |
| 2016 | $1,228 | $61,900 | $7,150 | $54,750 |
| 2015 | $1,079 | $57,300 | $6,600 | $50,700 |
| 2014 | $1,056 | $52,100 | $6,000 | $46,100 |
| 2013 | $1,211 | $47,600 | $6,000 | $41,600 |
M
Seller's Agent in 2025
Mike Kane
Raboin Realty
(701) 446-7171
109 Total Sales

Seller Co-Listing Agent in 2025
Brandon Raboin
Raboin Realty
(651) 380-3307
412 Total Sales
S
Buyer's Agent in 2025
Soren McDaniel
eXp Realty (3788 FGO)
(701) 680-9796
72 Total Sales
Source: NorthstarMLS
MLS Number: 6750334
APN: 18-0100-13810-090
Disclaimer: Certain information contained herein is derived from information provided by parties other than Homes.com. All information provided is deemed reliable, but is not guaranteed to be accurate and should be independently verified.
![]() Based on information submitted to the MLS GRID. All data is obtained from various sources and may not have been verified by broker or MLS GRID. Supplied Open House Information is subject to change without notice. All information should be independently reviewed and verified for accuracy. Properties may or may not be listed by the office/agent presenting the information. Some IDX listings have been excluded from this website.
Based on information submitted to the MLS GRID. All data is obtained from various sources and may not have been verified by broker or MLS GRID. Supplied Open House Information is subject to change without notice. All information should be independently reviewed and verified for accuracy. Properties may or may not be listed by the office/agent presenting the information. Some IDX listings have been excluded from this website.
Based on information submitted to the MLS GRID
Ask me questions while you tour the home.