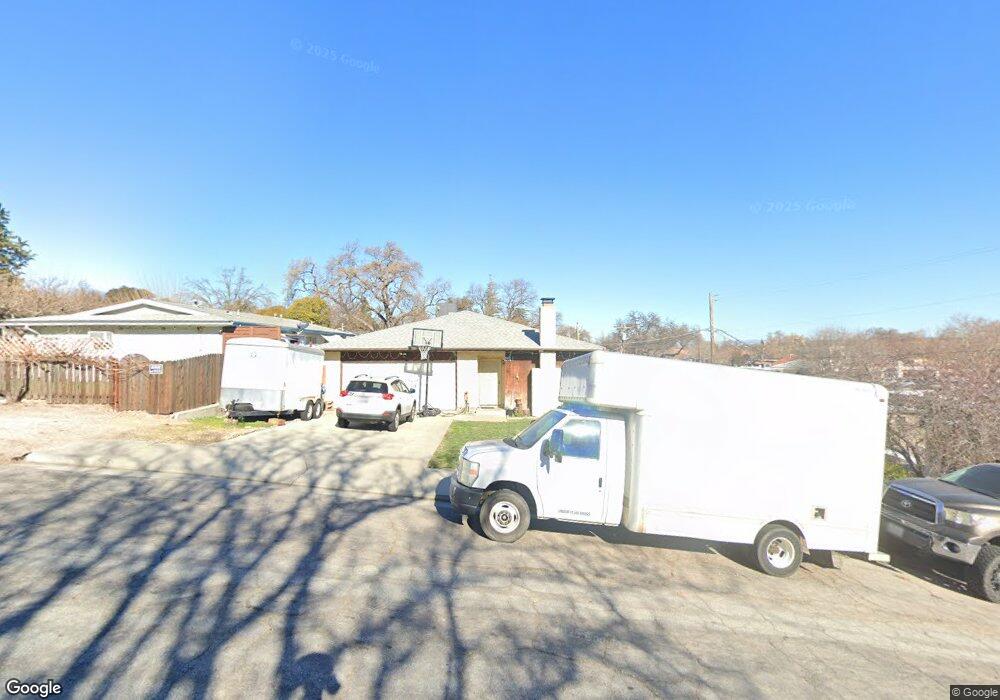
611 5th St Paso Robles, CA 93446
Estimated Value: $627,801 - $880,000
3
Beds
2
Baths
1,417
Sq Ft
$529/Sq Ft
Est. Value
About This Home
This home is located at 611 5th St, Paso Robles, CA 93446 and is currently estimated at $749,200, approximately $528 per square foot. 611 5th St is a home located in San Luis Obispo County with nearby schools including Glen Speck Elementary School, George H. Flamson Middle School, and Paso Robles High School.
Ownership History
Date
Name
Owned For
Owner Type
Purchase Details
Closed on
Jul 17, 2017
Sold by
Chun Sang and An Chong Suk
Bought by
An Hyon and An Allyson
Current Estimated Value
Purchase Details
Closed on
Feb 1, 2002
Sold by
An Sang Chun and An Chong Suk
Bought by
An Sang Chun and An Chong Suk
Home Financials for this Owner
Home Financials are based on the most recent Mortgage that was taken out on this home.
Original Mortgage
$70,000
Interest Rate
6.8%
Create a Home Valuation Report for This Property
The Home Valuation Report is an in-depth analysis detailing your home's value as well as a comparison with similar homes in the area
Purchase History
We collect this data history from publicly available records. To have your information removed, we recommend requesting removal directly through your county’s website.
| Date | Buyer | Sale Price | Title Company |
|---|---|---|---|
| An Hyon | -- | None Available | |
| An Sang Chun | $35,000 | Fidelity Title Company |
Source: Public Records
Mortgage History
We collect this data history from publicly available records. To have your information removed, we recommend requesting removal directly through your county’s website.
| Date | Status | Borrower | Loan Amount |
|---|---|---|---|
| Previous Owner | An Sang Chun | $70,000 |
Source: Public Records
Tax History
| Year | Tax Paid | Tax Assessment Tax Assessment Total Assessment is a certain percentage of the fair market value that is determined by local assessors to be the total taxable value of land and additions on the property. | Land | Improvement |
|---|---|---|---|---|
| 2025 | $1,548 | $142,068 | $32,173 | $109,895 |
| 2024 | $1,523 | $139,284 | $31,543 | $107,741 |
| 2023 | $1,523 | $136,554 | $30,925 | $105,629 |
| 2022 | $1,501 | $133,877 | $30,319 | $103,558 |
| 2021 | $1,475 | $131,253 | $29,725 | $101,528 |
| 2020 | $1,455 | $129,908 | $29,421 | $100,487 |
| 2019 | $1,355 | $127,362 | $28,845 | $98,517 |
| 2018 | $1,336 | $124,866 | $28,280 | $96,586 |
| 2017 | $1,330 | $122,419 | $27,726 | $94,693 |
| 2016 | $1,304 | $120,020 | $27,183 | $92,837 |
| 2015 | $1,222 | $118,218 | $26,775 | $91,443 |
| 2014 | $1,179 | $115,903 | $26,251 | $89,652 |
Source: Public Records
Map
Nearby Homes
Your Personal Tour Guide
Ask me questions while you tour the home.