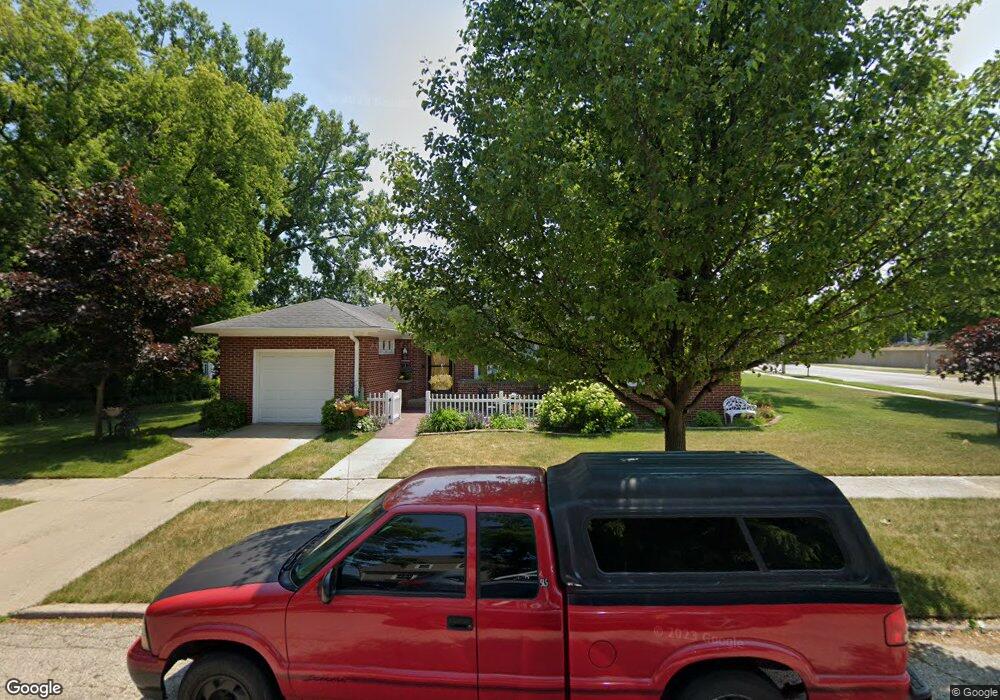
611 69th St Kenosha, WI 53143
Allendale NeighborhoodEstimated Value: $272,000 - $456,000
2
Beds
1
Bath
1,022
Sq Ft
$317/Sq Ft
Est. Value
About This Home
This home is located at 611 69th St, Kenosha, WI 53143 and is currently estimated at $324,108, approximately $317 per square foot. 611 69th St is a home located in Kenosha County with nearby schools including Southport Elementary School, Lincoln Middle School, and Tremper High School.
Ownership History
Date
Name
Owned For
Owner Type
Purchase Details
Closed on
Mar 12, 2018
Sold by
Persons Kari
Bought by
Mueller Cynthia A and Mueller Douglas
Current Estimated Value
Home Financials for this Owner
Home Financials are based on the most recent Mortgage that was taken out on this home.
Original Mortgage
$135,000
Outstanding Balance
$78,469
Interest Rate
4.38%
Mortgage Type
New Conventional
Estimated Equity
$245,639
Purchase Details
Closed on
Mar 6, 2015
Sold by
Spriegel Amanda De Young
Bought by
Persons Kari
Home Financials for this Owner
Home Financials are based on the most recent Mortgage that was taken out on this home.
Original Mortgage
$99,000
Interest Rate
3.56%
Mortgage Type
Unknown
Purchase Details
Closed on
Dec 29, 2008
Sold by
Deyoung Spriegel Aimanda
Bought by
The Deyoung Fam Asset Trust
Purchase Details
Closed on
Dec 26, 2008
Sold by
The Morris A Deyoung Revoc Fam Trust
Bought by
Deyowg Spriegel Amanda
Create a Home Valuation Report for This Property
The Home Valuation Report is an in-depth analysis detailing your home's value as well as a comparison with similar homes in the area
Home Values in the Area
Average Home Value in this Area
Purchase History
| Date | Buyer | Sale Price | Title Company |
|---|---|---|---|
| Mueller Cynthia A | $145,000 | -- | |
| Persons Kari | $110,000 | -- | |
| The Deyoung Fam Asset Trust | $160,000 | -- | |
| Deyowg Spriegel Amanda | $160,000 | -- |
Source: Public Records
Mortgage History
| Date | Status | Borrower | Loan Amount |
|---|---|---|---|
| Open | Mueller Cynthia A | $135,000 | |
| Previous Owner | Persons Kari | $99,000 |
Source: Public Records
Tax History Compared to Growth
Tax History
| Year | Tax Paid | Tax Assessment Tax Assessment Total Assessment is a certain percentage of the fair market value that is determined by local assessors to be the total taxable value of land and additions on the property. | Land | Improvement |
|---|---|---|---|---|
| 2024 | $3,451 | $148,400 | $47,300 | $101,100 |
| 2023 | $3,451 | $148,400 | $47,300 | $101,100 |
| 2022 | $3,499 | $148,400 | $47,300 | $101,100 |
| 2021 | $3,592 | $148,400 | $47,300 | $101,100 |
| 2020 | $3,715 | $148,400 | $47,300 | $101,100 |
| 2019 | $3,570 | $148,400 | $47,300 | $101,100 |
| 2018 | $3,477 | $127,600 | $47,300 | $80,300 |
| 2017 | $3,331 | $127,600 | $47,300 | $80,300 |
| 2016 | $3,255 | $127,600 | $47,300 | $80,300 |
| 2015 | $3,085 | $116,500 | $47,300 | $69,200 |
| 2014 | $3,061 | $116,500 | $47,300 | $69,200 |
Source: Public Records
Map
Nearby Homes