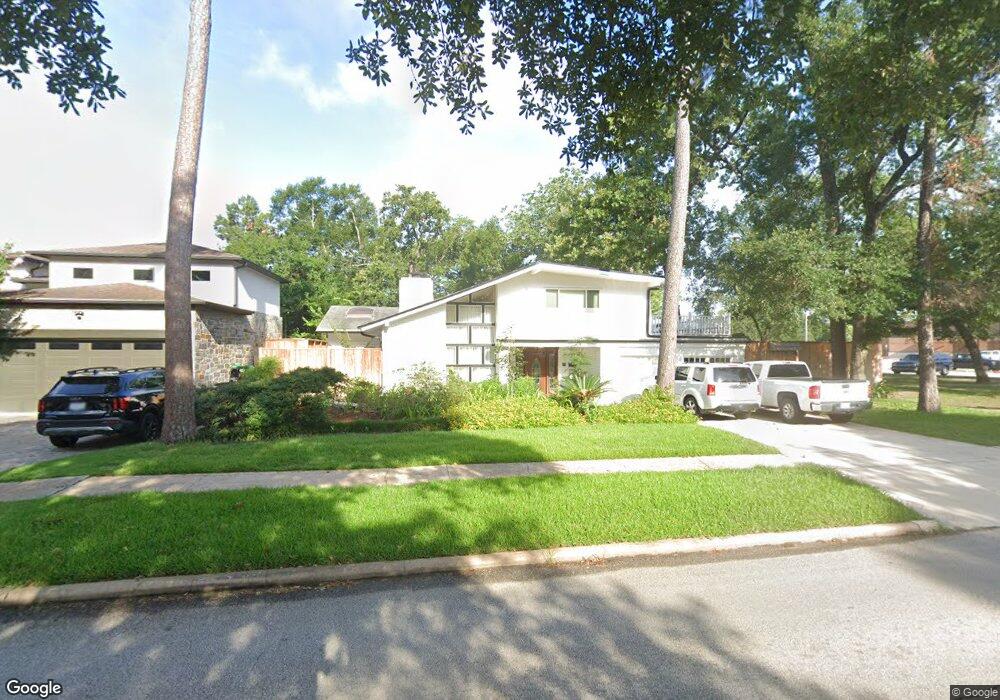
611 Brittmoore Rd Houston, TX 77079
Memorial NeighborhoodEstimated Value: $839,000 - $1,019,000
3
Beds
3
Baths
2,648
Sq Ft
$348/Sq Ft
Est. Value
About This Home
This home is located at 611 Brittmoore Rd, Houston, TX 77079 and is currently estimated at $920,372, approximately $347 per square foot. 611 Brittmoore Rd is a home located in Harris County with nearby schools including Rummel Creek Elementary School, Memorial Middle, and Stratford High School.
Ownership History
Date
Name
Owned For
Owner Type
Purchase Details
Closed on
Sep 18, 2025
Sold by
Banani Kamal and Banani Mahnaz
Bought by
Kamal And Mahnaz Banani Living Trust and Banani
Current Estimated Value
Purchase Details
Closed on
Mar 28, 2017
Sold by
Banani Mahnaz
Bought by
Banani Kamal H
Purchase Details
Closed on
Sep 4, 2001
Sold by
Boyd Joyce and Houston Independent School Dis
Bought by
Banani Kamal
Purchase Details
Closed on
May 24, 2000
Sold by
Porcaro Paul and Porcaro Melissa
Bought by
Banani Mahnaz
Home Financials for this Owner
Home Financials are based on the most recent Mortgage that was taken out on this home.
Original Mortgage
$160,000
Interest Rate
8.5%
Mortgage Type
Stand Alone First
Purchase Details
Closed on
Jul 13, 1994
Sold by
Baker Danette Lorraine
Bought by
Porcaro Paul and Porcaro Melissa
Home Financials for this Owner
Home Financials are based on the most recent Mortgage that was taken out on this home.
Original Mortgage
$134,900
Interest Rate
8.52%
Create a Home Valuation Report for This Property
The Home Valuation Report is an in-depth analysis detailing your home's value as well as a comparison with similar homes in the area
Home Values in the Area
Average Home Value in this Area
Purchase History
| Date | Buyer | Sale Price | Title Company |
|---|---|---|---|
| Kamal And Mahnaz Banani Living Trust | -- | None Listed On Document | |
| Banani Kamal H | -- | None Available | |
| Banani Kamal | $5,200 | -- | |
| Banani Mahnaz | -- | Chicago Title Insurance Co | |
| Porcaro Paul | -- | -- |
Source: Public Records
Mortgage History
| Date | Status | Borrower | Loan Amount |
|---|---|---|---|
| Previous Owner | Banani Mahnaz | $160,000 | |
| Previous Owner | Porcaro Paul | $134,900 |
Source: Public Records
Tax History Compared to Growth
Tax History
| Year | Tax Paid | Tax Assessment Tax Assessment Total Assessment is a certain percentage of the fair market value that is determined by local assessors to be the total taxable value of land and additions on the property. | Land | Improvement |
|---|---|---|---|---|
| 2025 | $10,427 | $724,148 | $544,752 | $179,396 |
| 2024 | $10,427 | $824,877 | $499,356 | $325,521 |
| 2023 | $10,427 | $810,613 | $499,356 | $311,257 |
| 2022 | $16,973 | $786,338 | $499,356 | $286,982 |
| 2021 | $16,114 | $720,758 | $481,198 | $239,560 |
| 2020 | $15,034 | $600,000 | $481,198 | $118,802 |
| 2019 | $16,173 | $617,771 | $481,198 | $136,573 |
| 2018 | $5,068 | $617,771 | $481,198 | $136,573 |
| 2017 | $15,497 | $635,000 | $481,198 | $153,802 |
| 2016 | $14,088 | $664,000 | $481,198 | $182,802 |
| 2015 | $4,511 | $687,671 | $481,198 | $206,473 |
| 2014 | $4,511 | $513,543 | $317,772 | $195,771 |
Source: Public Records
Map
Nearby Homes
- 13131 Kimberley Ln
- 414 E Gaywood Dr
- 839 Wax Myrtle Ln
- 12903 Tosca Ln
- 13403 Taylorcrest Rd
- 334 Wycliffe Dr
- 12910 Traviata Dr
- 13004 Trail Hollow Dr Unit A
- 807 Wycliffe Dr
- 893 Wax Myrtle Ln Unit 3
- 903 Wax Myrtle Ln
- 921 Wax Myrtle Ln
- 939 Wax Myrtle Ln
- 12984 Trail Hollow Dr Unit 2984
- 832 Wax Myrtle Ln Unit 832
- 12978 Trail Hollow Dr Unit 2978
- 327 Electra Dr
- 12971 Trail Hollow Dr Unit A
- 12973 Trail Hollow Dr Unit A
- 13346 Trail Hollow Dr Unit 3346
- 607 Brittmoore Rd
- 13055 Taylorcrest Rd
- 603 Brittmoore Rd
- 13054 Memorial Dr
- 13054 Taylorcrest Rd
- 13051 Taylorcrest Rd
- 13050 Memorial Dr
- 13050 Taylorcrest Rd
- 13047 Taylorcrest Rd
- 13055 Pebblebrook Dr
- 13046 Taylorcrest Rd
- 13051 Pebblebrook Dr
- 13043 Taylorcrest Rd
- 450 Wilchester Blvd
- 13042 Memorial Dr
- 13042 Taylorcrest Rd
- 13047 Pebblebrook Dr
- 13039 Taylorcrest Rd
- 13038 Memorial Dr
- 451 Wilchester Blvd