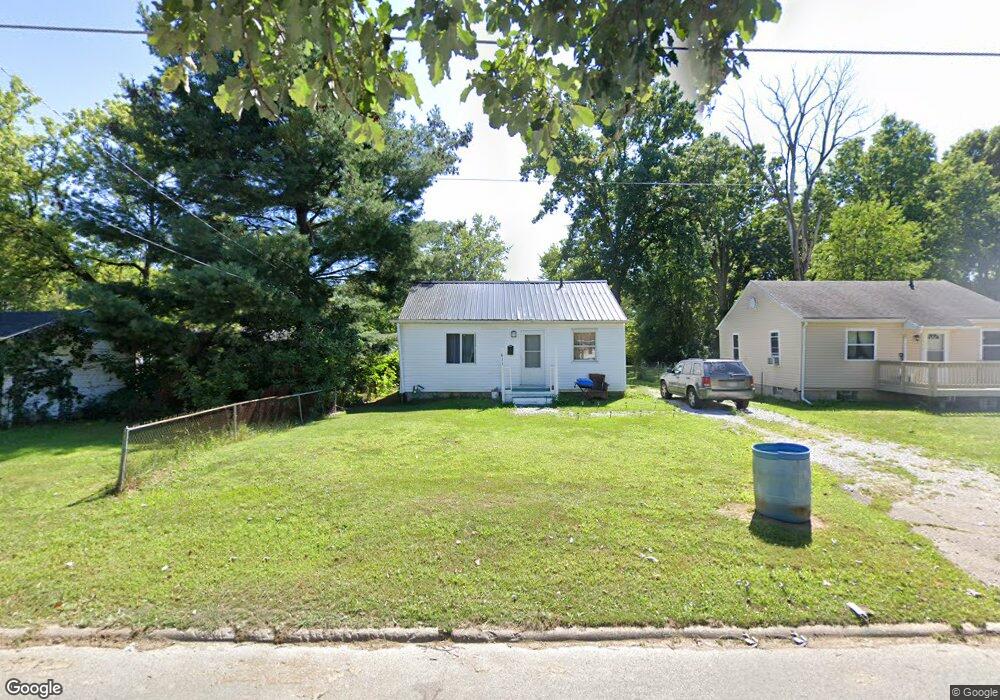
611 Burns St Mansfield, OH 44903
Estimated Value: $66,616 - $78,000
3
Beds
1
Bath
1,120
Sq Ft
$63/Sq Ft
Est. Value
About This Home
This home is located at 611 Burns St, Mansfield, OH 44903 and is currently estimated at $70,904, approximately $63 per square foot. 611 Burns St is a home located in Richland County with nearby schools including Foundation Academy, Mansfield Elective Academy, and Goal Digital Academy.
Ownership History
Date
Name
Owned For
Owner Type
Purchase Details
Closed on
May 15, 2014
Sold by
Knox Mark A and Knox Monica L
Bought by
Schunatz Gary and Schunatz Cathy
Current Estimated Value
Purchase Details
Closed on
Dec 22, 2006
Sold by
Hsbc Bank Usa Na
Bought by
Knox Mark A and Knox Monica L
Purchase Details
Closed on
Jun 26, 2006
Sold by
Kunkle Jodine and Case #05-857D
Bought by
Hsbc Bank Usa
Purchase Details
Closed on
Oct 20, 2004
Sold by
Sharrock David R and Sharrock Doris A
Bought by
Kunkle David B and Kunkle Jodine
Home Financials for this Owner
Home Financials are based on the most recent Mortgage that was taken out on this home.
Original Mortgage
$42,300
Interest Rate
5.93%
Mortgage Type
Purchase Money Mortgage
Purchase Details
Closed on
Feb 8, 1993
Sold by
Burford Nancy Rose
Bought by
Sharrock David R
Create a Home Valuation Report for This Property
The Home Valuation Report is an in-depth analysis detailing your home's value as well as a comparison with similar homes in the area
Home Values in the Area
Average Home Value in this Area
Purchase History
| Date | Buyer | Sale Price | Title Company |
|---|---|---|---|
| Schunatz Gary | $2,132 | Attorney | |
| Knox Mark A | $9,500 | Chicago Title | |
| Hsbc Bank Usa | $24,000 | None Available | |
| Kunkle David B | $47,000 | Acs Title | |
| Sharrock David R | -- | -- |
Source: Public Records
Mortgage History
| Date | Status | Borrower | Loan Amount |
|---|---|---|---|
| Previous Owner | Kunkle David B | $42,300 |
Source: Public Records
Tax History Compared to Growth
Tax History
| Year | Tax Paid | Tax Assessment Tax Assessment Total Assessment is a certain percentage of the fair market value that is determined by local assessors to be the total taxable value of land and additions on the property. | Land | Improvement |
|---|---|---|---|---|
| 2024 | $319 | $6,660 | $1,960 | $4,700 |
| 2023 | $319 | $6,660 | $1,960 | $4,700 |
| 2022 | $301 | $5,260 | $1,780 | $3,480 |
| 2021 | $303 | $5,260 | $1,780 | $3,480 |
| 2020 | $309 | $5,260 | $1,780 | $3,480 |
| 2019 | $343 | $5,260 | $1,780 | $3,480 |
| 2018 | $338 | $5,260 | $1,780 | $3,480 |
| 2017 | $477 | $7,610 | $1,780 | $5,830 |
| 2016 | $181 | $2,800 | $2,250 | $550 |
| 2015 | $181 | $2,800 | $2,250 | $550 |
| 2014 | $856 | $14,070 | $2,540 | $11,530 |
| 2012 | $656 | $14,070 | $2,670 | $11,400 |
Source: Public Records
Map
Nearby Homes
- 0 State Route 314 Unit 9069650
- 0 State Route 314 Unit 9067316
- 0 State Route 314 Unit 225021979
- 512 Burns St
- 480 Mcpherson St
- 0 Highway 30
- 426 Mcpherson St
- 269 Parkway Dr
- 237 Helen Ave
- 641 Averill Ave
- 0 Voegele Ave Unit Lot 6048, 6049, 6
- 170 Western Ave
- 185 Rowland Ave
- 212 Penn Ave
- 283 Bulkley Ave
- 362-364 W 6th St
- 371 Bell St
- 741 Burger Ave
- 526 Bowman St
- 120 Gettings Place