Estimated Value: $155,000 - $172,000
2
Beds
2
Baths
816
Sq Ft
$199/Sq Ft
Est. Value
About This Home
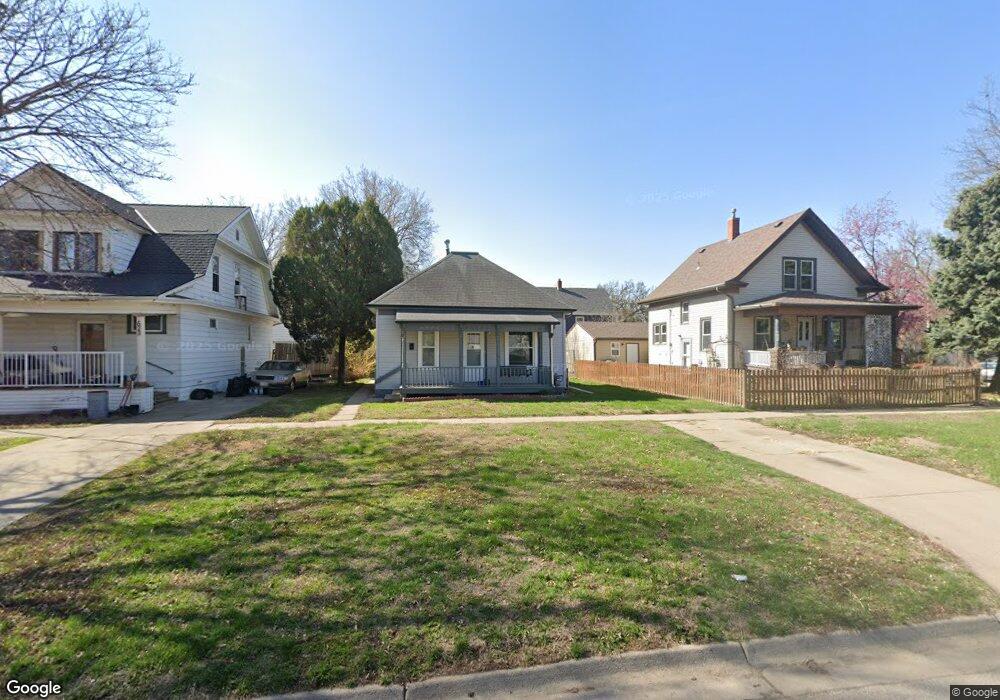
This home is located at 611 C St, Lincoln, NE 68502 and is currently estimated at $162,162, approximately $198 per square foot. 611 C St is a home located in Lancaster County with nearby schools including Everett Elementary School, Park Middle School, and Lincoln High School.
Ownership History
Date
Name
Owned For
Owner Type
Purchase Details
Closed on
Mar 24, 2010
Sold by
Schoenbaum Carla J
Bought by
Graham Bradley E and Graham Cathy A Maestas
Current Estimated Value
Home Financials for this Owner
Home Financials are based on the most recent Mortgage that was taken out on this home.
Original Mortgage
$32,280
Outstanding Balance
$21,341
Interest Rate
4.93%
Mortgage Type
New Conventional
Estimated Equity
$140,821
Purchase Details
Closed on
Aug 15, 2007
Sold by
Finlayson Jay K and Finlayson Jay
Bought by
Finlayson Jay and Jay Finlayson Revocable Trust
Create a Home Valuation Report for This Property
The Home Valuation Report is an in-depth analysis detailing your home's value as well as a comparison with similar homes in the area
Home Values in the Area
Average Home Value in this Area
Purchase History
| Date | Buyer | Sale Price | Title Company |
|---|---|---|---|
| Graham Bradley E | $44,000 | Utc | |
| Finlayson Jay | -- | None Available |
Source: Public Records
Mortgage History
| Date | Status | Borrower | Loan Amount |
|---|---|---|---|
| Open | Graham Bradley E | $32,280 |
Source: Public Records
Tax History Compared to Growth
Tax History
| Year | Tax Paid | Tax Assessment Tax Assessment Total Assessment is a certain percentage of the fair market value that is determined by local assessors to be the total taxable value of land and additions on the property. | Land | Improvement |
|---|---|---|---|---|
| 2025 | $1,963 | $156,000 | $36,000 | $120,000 |
| 2024 | $1,963 | $142,000 | $33,000 | $109,000 |
| 2023 | $2,380 | $142,000 | $33,000 | $109,000 |
| 2022 | $2,162 | $108,500 | $30,000 | $78,500 |
| 2021 | $2,046 | $108,500 | $30,000 | $78,500 |
| 2020 | $1,693 | $88,600 | $25,000 | $63,600 |
| 2019 | $1,693 | $88,600 | $25,000 | $63,600 |
| 2018 | $1,664 | $86,700 | $25,000 | $61,700 |
| 2017 | $1,680 | $86,700 | $25,000 | $61,700 |
| 2016 | $1,725 | $88,600 | $25,000 | $63,600 |
| 2015 | $1,713 | $88,600 | $25,000 | $63,600 |
| 2014 | $1,511 | $77,700 | $25,000 | $52,700 |
| 2013 | -- | $77,700 | $25,000 | $52,700 |
Source: Public Records
Map
Nearby Homes