Estimated Value: $110,046 - $141,000
2
Beds
1
Bath
904
Sq Ft
$138/Sq Ft
Est. Value
About This Home
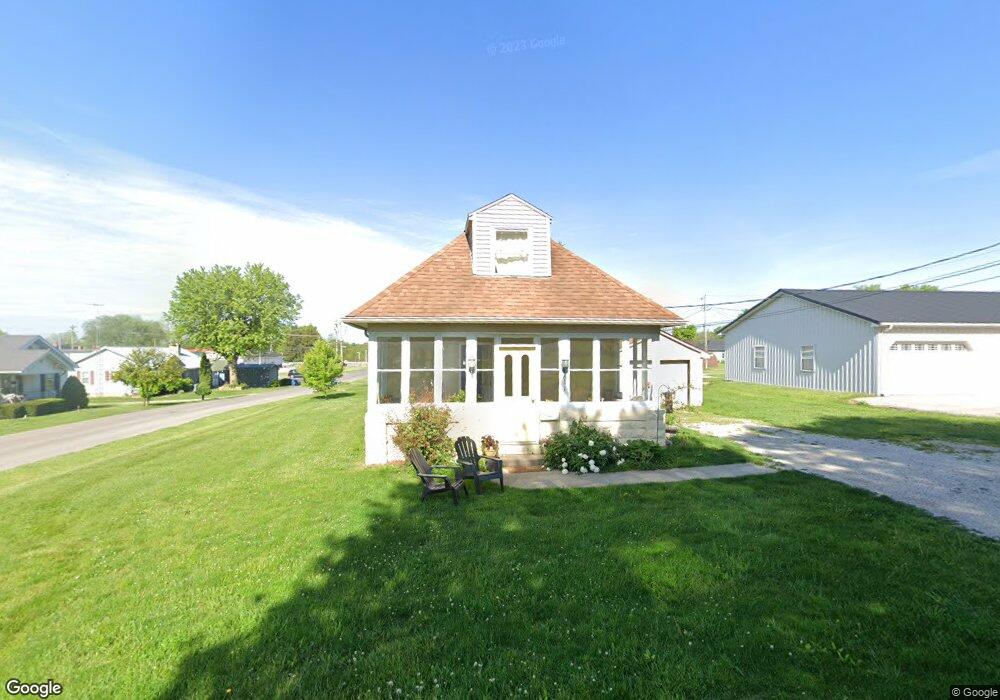
This home is located at 611 Carr St, Salem, IN 47167 and is currently estimated at $124,512, approximately $137 per square foot. 611 Carr St is a home located in Washington County with nearby schools including Bradie M. Shrum Lower Elementary School, Salem Middle School, and Salem High School.
Ownership History
Date
Name
Owned For
Owner Type
Purchase Details
Closed on
Mar 8, 2018
Sold by
Autumn Hall
Bought by
Jamie Mcclain
Current Estimated Value
Home Financials for this Owner
Home Financials are based on the most recent Mortgage that was taken out on this home.
Original Mortgage
$74,472
Outstanding Balance
$60,273
Interest Rate
4.62%
Mortgage Type
FHA
Estimated Equity
$64,239
Purchase Details
Closed on
Sep 12, 2013
Sold by
Hall Justin
Bought by
Mcclain Jamie
Purchase Details
Closed on
Nov 26, 2007
Sold by
Scott Autumn K and Hall Autuman
Bought by
Hall Autumn and Hall Justin
Purchase Details
Closed on
Feb 7, 2006
Sold by
Chastain Dennis A and Chastain Lavon
Bought by
Scott Autumn K
Home Financials for this Owner
Home Financials are based on the most recent Mortgage that was taken out on this home.
Original Mortgage
$46,570
Interest Rate
5.75%
Mortgage Type
Adjustable Rate Mortgage/ARM
Create a Home Valuation Report for This Property
The Home Valuation Report is an in-depth analysis detailing your home's value as well as a comparison with similar homes in the area
Home Values in the Area
Average Home Value in this Area
Purchase History
| Date | Buyer | Sale Price | Title Company |
|---|---|---|---|
| Jamie Mcclain | $75,000 | -- | |
| Mcclain Jamie | $75,000 | Fidelity National Title | |
| Mcclain Jamie | $75,000 | -- | |
| Hall Autumn | -- | None Available | |
| Scott Autumn K | -- | None Available |
Source: Public Records
Mortgage History
| Date | Status | Borrower | Loan Amount |
|---|---|---|---|
| Open | Mcclain Jamie | $74,472 | |
| Previous Owner | Scott Autumn K | $46,570 |
Source: Public Records
Tax History Compared to Growth
Tax History
| Year | Tax Paid | Tax Assessment Tax Assessment Total Assessment is a certain percentage of the fair market value that is determined by local assessors to be the total taxable value of land and additions on the property. | Land | Improvement |
|---|---|---|---|---|
| 2024 | $553 | $57,000 | $7,800 | $49,200 |
| 2023 | $502 | $51,800 | $7,800 | $44,000 |
| 2022 | $460 | $46,000 | $7,800 | $38,200 |
| 2021 | $422 | $42,200 | $7,800 | $34,400 |
| 2020 | $401 | $40,100 | $7,800 | $32,300 |
| 2019 | $385 | $38,500 | $7,800 | $30,700 |
| 2018 | $355 | $35,500 | $7,800 | $27,700 |
| 2017 | $205 | $36,200 | $7,800 | $28,400 |
| 2016 | $182 | $37,300 | $7,800 | $29,500 |
| 2014 | $166 | $37,400 | $7,800 | $29,600 |
| 2013 | $155 | $37,300 | $7,800 | $29,500 |
Source: Public Records
Map
Nearby Homes
- 701 S Main St
- 412 Ridgeview Dr
- 0 S Side South Boston Pekin Rd
- 52 Public Square
- 301 E Market St
- 805 Smith St
- (Tract 2) 5484 State Road 135
- 207 E Market St
- 205 S Harrison St
- 303 W Market St
- 404 E Mulberry St
- 104 Hounds Way
- 406 W Mulberry St
- 102 Mahuron Dr
- 101, 103, & 105 Hounds Way
- 120 N Brandywine Ct
- 105 Lincoln St
- 702 W Becks Mill Rd
- 115 Nichols Ave
- 1000 W Market St