Estimated Value: $387,000 - $409,000
4
Beds
3
Baths
3,074
Sq Ft
$129/Sq Ft
Est. Value
About This Home
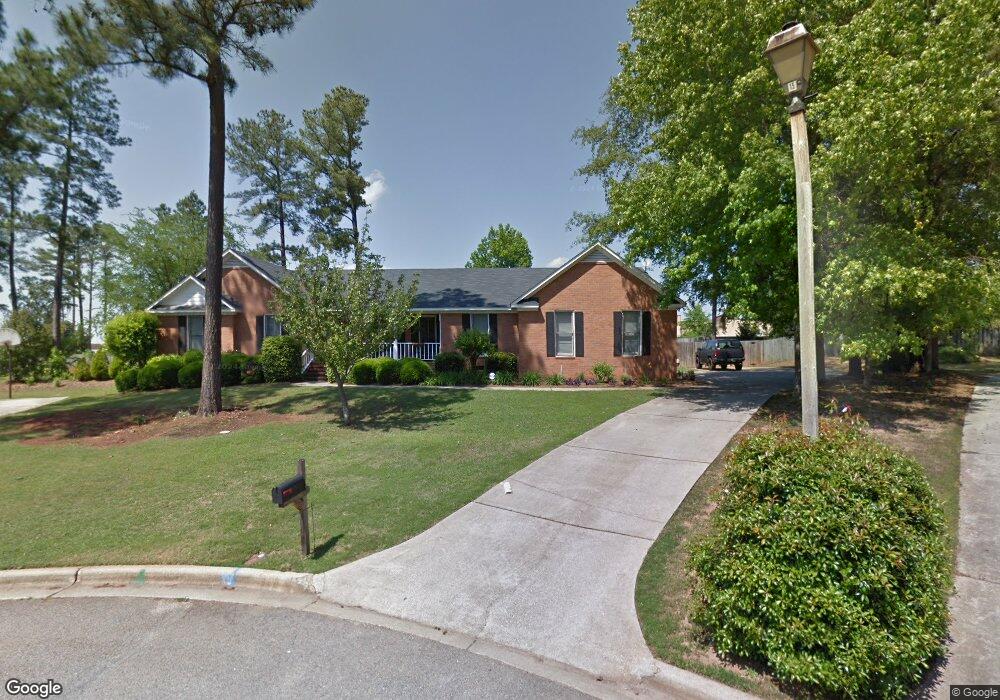
This home is located at 611 Chandler Ct, Evans, GA 30809 and is currently estimated at $395,623, approximately $128 per square foot. 611 Chandler Ct is a home located in Columbia County with nearby schools including Evans Elementary School, Evans Middle School, and Evans High School.
Ownership History
Date
Name
Owned For
Owner Type
Purchase Details
Closed on
Jan 8, 2013
Sold by
Drew Julie A
Bought by
Drew Phillip D
Current Estimated Value
Purchase Details
Closed on
Jan 17, 2006
Sold by
Fischer Bryan E
Bought by
Drew Phillip D
Home Financials for this Owner
Home Financials are based on the most recent Mortgage that was taken out on this home.
Original Mortgage
$172,800
Interest Rate
6.21%
Mortgage Type
New Conventional
Purchase Details
Closed on
Sep 29, 2005
Sold by
Prudential Relocation Mana
Bought by
Fischer Bryan E and Fischer Patricia R
Home Financials for this Owner
Home Financials are based on the most recent Mortgage that was taken out on this home.
Original Mortgage
$172,000
Interest Rate
5.66%
Mortgage Type
New Conventional
Create a Home Valuation Report for This Property
The Home Valuation Report is an in-depth analysis detailing your home's value as well as a comparison with similar homes in the area
Home Values in the Area
Average Home Value in this Area
Purchase History
| Date | Buyer | Sale Price | Title Company |
|---|---|---|---|
| Drew Phillip D | -- | -- | |
| Drew Phillip D | $216,000 | -- | |
| Fischer Bryan E | $215,000 | -- | |
| Prudential Relocation Manageme | $215,000 | -- |
Source: Public Records
Mortgage History
| Date | Status | Borrower | Loan Amount |
|---|---|---|---|
| Previous Owner | Drew Phillip D | $172,800 | |
| Previous Owner | Prudential Relocation Manageme | $172,000 | |
| Previous Owner | Prudential Relocation Manageme | $21,500 |
Source: Public Records
Tax History
| Year | Tax Paid | Tax Assessment Tax Assessment Total Assessment is a certain percentage of the fair market value that is determined by local assessors to be the total taxable value of land and additions on the property. | Land | Improvement |
|---|---|---|---|---|
| 2025 | $3,675 | $151,667 | $25,789 | $125,878 |
| 2024 | $3,771 | $148,618 | $24,744 | $123,874 |
| 2023 | $3,771 | $141,717 | $23,509 | $118,208 |
| 2022 | $3,170 | $119,749 | $20,279 | $99,470 |
| 2021 | $3,133 | $113,111 | $17,999 | $95,112 |
| 2020 | $3,106 | $109,776 | $17,904 | $91,872 |
| 2019 | $3,024 | $106,805 | $17,999 | $88,806 |
| 2018 | $2,806 | $98,626 | $16,479 | $82,147 |
| 2017 | $2,761 | $96,669 | $14,959 | $81,710 |
| 2016 | $2,490 | $90,208 | $16,075 | $74,133 |
| 2015 | $2,437 | $88,083 | $13,605 | $74,478 |
| 2014 | $2,337 | $83,332 | $11,325 | $72,007 |
Source: Public Records
Map
Nearby Homes
- 648 River Oaks Ln
- 4560 Mulberry Creek Dr
- 726 Whitney Shoals Rd
- 854 Sparkleberry Rd
- 4489 Woodberry Ct
- 4484 Woodberry Ct
- 525 Pheasant Run Dr
- 4421 Hereford Farm Rd
- 829 Woodberry Dr
- 4614 Stoneridge Ct
- 800 Sparkleberry Rd
- 802 Sparkleberry Rd
- 625 Dunloe Cir
- 4478 Cape Cod Dr
- 599 Windward Ct
- 642 Kimberley Place
- 604 Kimberley Place
- 4622 Brittany Dr
- 668 Deerwood Way
- 656 Deerwood Way
- 610 Chandler Ct
- 609 Chandler Ct
- 4446 Washington Rd
- 608 Chandler Ct
- 607 Chandler Ct
- 537 Astor Ct
- 606 Chandler Ct
- 4440 Washington Rd
- 539 Astor Ct
- 4436 Washington Rd
- 605 Chandler Ct
- 4448 Washington Rd
- 604 Chandler Ct
- 610 Branett Way
- 541 Astor Ct
- 530 Astor Ct
- 4434 Washington Rd
- 603 Chandler Ct
- 608 Branett Way
- 612 Branett Way
Your Personal Tour Guide
Ask me questions while you tour the home.