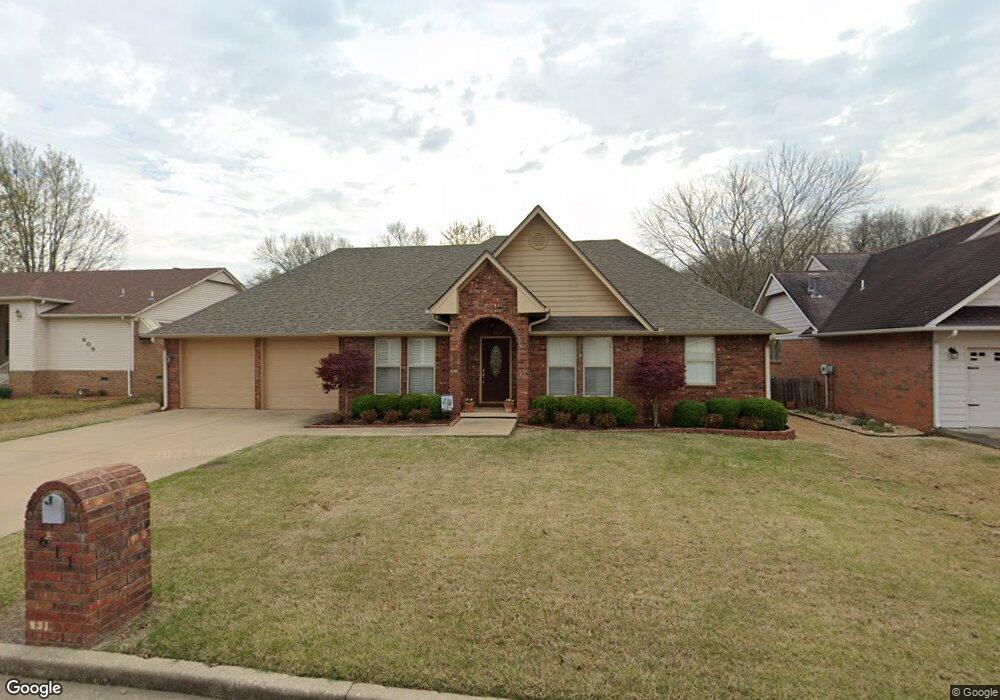
611 Chapman Ave Tahlequah, OK 74464
Estimated Value: $278,284 - $317,000
3
Beds
2
Baths
2,186
Sq Ft
$137/Sq Ft
Est. Value
About This Home
This home is located at 611 Chapman Ave, Tahlequah, OK 74464 and is currently estimated at $298,571, approximately $136 per square foot. 611 Chapman Ave is a home located in Cherokee County with nearby schools including Greenwood Elementary School, Cherokee Elementary School, and Tahlequah Middle School.
Ownership History
Date
Name
Owned For
Owner Type
Purchase Details
Closed on
Mar 4, 2009
Sold by
Green Gilbert F and Green Reba
Bought by
Presley Christopher and Presley Lesley
Current Estimated Value
Home Financials for this Owner
Home Financials are based on the most recent Mortgage that was taken out on this home.
Original Mortgage
$157,320
Outstanding Balance
$99,232
Interest Rate
5.06%
Mortgage Type
New Conventional
Estimated Equity
$199,339
Purchase Details
Closed on
Jun 9, 2005
Sold by
Tullis Brad and Tullis Beatrice
Bought by
Green Gilbert F and Green Reba
Home Financials for this Owner
Home Financials are based on the most recent Mortgage that was taken out on this home.
Original Mortgage
$157,477
Interest Rate
5.79%
Mortgage Type
FHA
Purchase Details
Closed on
Nov 18, 2004
Sold by
Russell and Carolyn Carlile
Bought by
Brad Tullis
Purchase Details
Closed on
Oct 16, 2000
Sold by
Merle and Cooie Meigs
Bought by
Russell and Carolyn Carlile
Create a Home Valuation Report for This Property
The Home Valuation Report is an in-depth analysis detailing your home's value as well as a comparison with similar homes in the area
Home Values in the Area
Average Home Value in this Area
Purchase History
| Date | Buyer | Sale Price | Title Company |
|---|---|---|---|
| Presley Christopher | $171,000 | Scott Title & Escrow | |
| Green Gilbert F | $160,000 | None Available | |
| Brad Tullis | $13,500 | -- | |
| Russell | $14,000 | -- |
Source: Public Records
Mortgage History
| Date | Status | Borrower | Loan Amount |
|---|---|---|---|
| Open | Presley Christopher | $157,320 | |
| Previous Owner | Green Gilbert F | $157,477 |
Source: Public Records
Tax History Compared to Growth
Tax History
| Year | Tax Paid | Tax Assessment Tax Assessment Total Assessment is a certain percentage of the fair market value that is determined by local assessors to be the total taxable value of land and additions on the property. | Land | Improvement |
|---|---|---|---|---|
| 2025 | $2,090 | $23,157 | $1,696 | $21,461 |
| 2024 | $2,090 | $22,055 | $1,616 | $20,439 |
| 2023 | $2,090 | $21,004 | $1,210 | $19,794 |
| 2022 | $1,949 | $21,004 | $1,210 | $19,794 |
| 2021 | $1,956 | $21,004 | $1,210 | $19,794 |
| 2020 | $1,991 | $21,004 | $1,210 | $19,794 |
| 2019 | $1,937 | $20,619 | $1,210 | $19,409 |
| 2018 | $1,867 | $19,637 | $1,210 | $18,427 |
| 2017 | $1,863 | $19,637 | $1,210 | $18,427 |
| 2016 | $1,949 | $20,415 | $1,210 | $19,205 |
| 2015 | $1,771 | $19,443 | $1,210 | $18,233 |
| 2014 | $1,771 | $18,810 | $1,210 | $17,600 |
Source: Public Records
Map
Nearby Homes
- 605 S Oak Ave
- 508 Covington Place
- 720 S East Ave
- 413 Greenwood Dr
- 702 Wilson Ave
- 104 Tommye Ln
- 215 S Maple Ave
- 201 Sandy Cir
- 403 S Bluff Ave
- 1005 Kaufman Ave
- 306 Short St
- 1105 S Maple Ave
- 103 S Harrison Ave
- 200 Remington Place
- 101 S Harrison Ave
- 757 S Bluff Ave
- 111 N Logan Dr
- 725 Sooner Dr
- 0 S Hwy 82 A Hwy Unit 2532332
- 528 S Muskogee Ave
- 609 Chapman Ave
- 613 Chapman Ave
- 607 Chapman Ave
- 608 Chapman Ave
- 605 Quail Ridge Dr
- 605 Chapman Ave
- 703 Chapman Ave
- 606 Chapman Ave
- 510 Forest Ridge Dr
- 603 Chapman Ave
- 609 S Oak Ave
- 601 Quail Ridge Dr
- 604 Chapman Ave
- 604 Quail Ridge Dr
- 2021 Shady Oak
- 607 S Oak Ave
- 600 Quail Ridge Dr
- 602 Chapman Ave
- 601 Chapman Ave
- 707 Chapman Ave