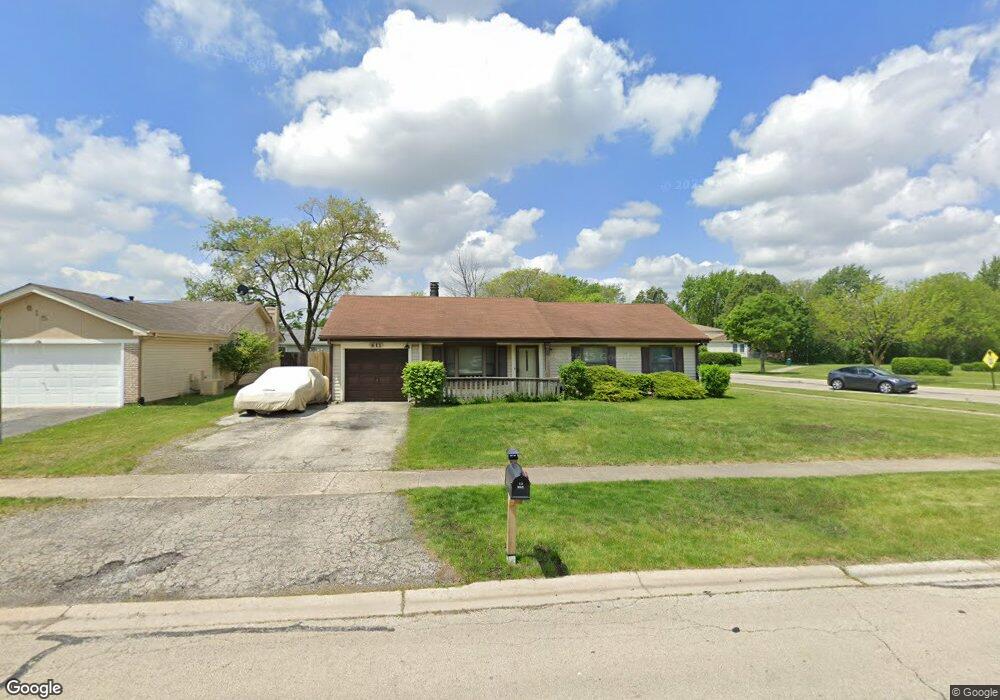
611 Chesapeake Dr Bolingbrook, IL 60440
East Bolingbrook NeighborhoodEstimated Value: $266,558 - $310,000
3
Beds
1
Bath
1,096
Sq Ft
$260/Sq Ft
Est. Value
About This Home
This home is located at 611 Chesapeake Dr, Bolingbrook, IL 60440 and is currently estimated at $285,390, approximately $260 per square foot. 611 Chesapeake Dr is a home located in Will County with nearby schools including Jonas E Salk Elementary School, Hubert H Humphrey Middle School, and Bolingbrook High School.
Ownership History
Date
Name
Owned For
Owner Type
Purchase Details
Closed on
Jul 18, 2001
Sold by
Whitlock Richard M and Whitlock Michele Mary Theresa
Bought by
Alvarado David
Current Estimated Value
Home Financials for this Owner
Home Financials are based on the most recent Mortgage that was taken out on this home.
Original Mortgage
$123,751
Interest Rate
7.11%
Mortgage Type
FHA
Purchase Details
Closed on
Aug 7, 1998
Sold by
Whitlock Richard M
Bought by
Whitlock Richard M and Whitlock Michele Mary Theresa
Purchase Details
Closed on
Jan 18, 1996
Sold by
Shaw Brian S and Shaw Mary V
Bought by
Whitlock Richard M
Home Financials for this Owner
Home Financials are based on the most recent Mortgage that was taken out on this home.
Original Mortgage
$95,400
Interest Rate
6.75%
Create a Home Valuation Report for This Property
The Home Valuation Report is an in-depth analysis detailing your home's value as well as a comparison with similar homes in the area
Home Values in the Area
Average Home Value in this Area
Purchase History
| Date | Buyer | Sale Price | Title Company |
|---|---|---|---|
| Alvarado David | $125,500 | -- | |
| Whitlock Richard M | -- | -- | |
| Whitlock Richard M | $106,000 | Chicago Title Insurance Co |
Source: Public Records
Mortgage History
| Date | Status | Borrower | Loan Amount |
|---|---|---|---|
| Previous Owner | Alvarado David | $123,751 | |
| Previous Owner | Whitlock Richard M | $95,400 |
Source: Public Records
Tax History Compared to Growth
Tax History
| Year | Tax Paid | Tax Assessment Tax Assessment Total Assessment is a certain percentage of the fair market value that is determined by local assessors to be the total taxable value of land and additions on the property. | Land | Improvement |
|---|---|---|---|---|
| 2024 | $6,027 | $73,263 | $18,564 | $54,699 |
| 2023 | $6,027 | $65,919 | $16,703 | $49,216 |
| 2022 | $5,281 | $59,430 | $15,059 | $44,371 |
| 2021 | $4,990 | $55,568 | $14,080 | $41,488 |
| 2020 | $4,829 | $53,741 | $13,617 | $40,124 |
| 2019 | $4,662 | $51,182 | $12,969 | $38,213 |
| 2018 | $4,465 | $48,987 | $12,413 | $36,574 |
| 2017 | $4,238 | $46,433 | $11,766 | $34,667 |
| 2016 | $4,102 | $44,200 | $11,200 | $33,000 |
| 2015 | $3,818 | $42,400 | $10,700 | $31,700 |
| 2014 | $3,818 | $40,400 | $10,200 | $30,200 |
| 2013 | $3,818 | $44,500 | $11,300 | $33,200 |
Source: Public Records
Map
Nearby Homes
- 304 N Pinecrest Rd
- 520 White Oak Rd
- 564 White Oak Rd
- 144 N Pinecrest Rd
- 308 Homewood Dr
- 157 Vernon Dr Unit 6
- 101 Seabury Rd
- 338 Stafford Way
- 220 N Ashbury Ave
- 129 Oxford Rd Unit 5
- 451 Alcester Ct
- 325 Rockhurst Rd
- 316 Bedford Rd
- 308 Pacific Dr
- 113 Cedarwood Ave
- 168 Bedford Rd
- 208 S Pinecrest Rd
- 220 Falcon Ridge Way
- 219 Monterey Dr
- 233 Malibu Dr Unit 4
- 615 Chesapeake Dr
- 604 Melissa Dr
- 619 Chesapeake Dr
- 610 Chesapeake Dr
- 614 Chesapeake Dr
- 608 Melissa Dr
- 623 Chesapeake Dr
- 640 Niagara Dr
- 612 Melissa Dr
- 554 Rockhurst Rd
- 647 Rockhurst Rd
- 604 Rockhurst Rd
- 644 Niagara Dr
- 616 Melissa Dr
- 550 Rockhurst Rd
- 608 Rockhurst Rd
- 651 Rockhurst Rd
- 648 Niagara Dr
- 639 Niagara Dr
- 631 Chesapeake Dr