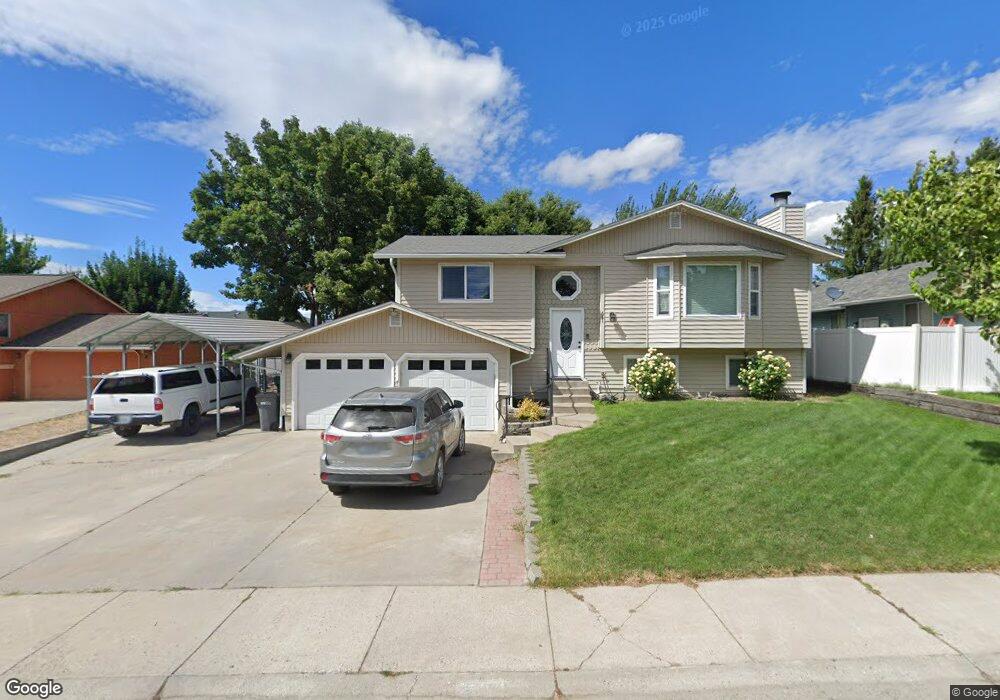
611 Cindy Ct East Wenatchee, WA 98802
Estimated Value: $410,000 - $596,000
2
Beds
2
Baths
1,049
Sq Ft
$482/Sq Ft
Est. Value
About This Home
This home is located at 611 Cindy Ct, East Wenatchee, WA 98802 and is currently estimated at $505,670, approximately $482 per square foot. 611 Cindy Ct is a home located in Douglas County with nearby schools including Sterling Intermediate School, Eastmont Junior High School, and Eastmont Senior High School.
Ownership History
Date
Name
Owned For
Owner Type
Purchase Details
Closed on
Nov 5, 2021
Sold by
Allen David and Allen Cheri
Bought by
Allen Kyle David
Current Estimated Value
Home Financials for this Owner
Home Financials are based on the most recent Mortgage that was taken out on this home.
Original Mortgage
$292,700
Outstanding Balance
$268,283
Interest Rate
3.01%
Mortgage Type
New Conventional
Estimated Equity
$237,387
Purchase Details
Closed on
Feb 14, 2020
Sold by
Lane David W and Lane Wendy R
Bought by
Allen David and Allen Cheri
Home Financials for this Owner
Home Financials are based on the most recent Mortgage that was taken out on this home.
Original Mortgage
$292,500
Interest Rate
3.72%
Mortgage Type
New Conventional
Create a Home Valuation Report for This Property
The Home Valuation Report is an in-depth analysis detailing your home's value as well as a comparison with similar homes in the area
Home Values in the Area
Average Home Value in this Area
Purchase History
| Date | Buyer | Sale Price | Title Company |
|---|---|---|---|
| Allen Kyle David | -- | North Meridian T&E Llc | |
| Allen David | $325,000 | First American Title Ins Co |
Source: Public Records
Mortgage History
| Date | Status | Borrower | Loan Amount |
|---|---|---|---|
| Open | Allen Kyle David | $292,700 | |
| Closed | Allen David | $292,500 |
Source: Public Records
Tax History Compared to Growth
Tax History
| Year | Tax Paid | Tax Assessment Tax Assessment Total Assessment is a certain percentage of the fair market value that is determined by local assessors to be the total taxable value of land and additions on the property. | Land | Improvement |
|---|---|---|---|---|
| 2025 | $260 | $435,000 | $100,000 | $335,000 |
| 2024 | $3,698 | $424,200 | $100,000 | $324,200 |
| 2023 | $3,387 | $334,500 | $100,000 | $234,500 |
| 2022 | $3,170 | $289,400 | $80,000 | $209,400 |
| 2021 | $3,267 | $289,400 | $80,000 | $209,400 |
| 2020 | $3,173 | $275,200 | $72,000 | $203,200 |
| 2018 | $2,741 | $225,200 | $60,000 | $165,200 |
| 2017 | $2,266 | $225,200 | $60,000 | $165,200 |
| 2016 | $2,058 | $200,600 | $60,000 | $140,600 |
| 2015 | $1,984 | $184,500 | $60,000 | $124,500 |
| 2014 | -- | $170,500 | $60,000 | $110,500 |
| 2013 | -- | $167,300 | $60,000 | $107,300 |
Source: Public Records
Map
Nearby Homes
- 520 11th St NE Unit 21
- 845 N Devon Ave
- 1040 Gilbert Ct
- 646 N Gale Place
- 1046 Corum Cir
- 1352 Eastmont Ave Unit 15
- 1051 N Baker Ave Unit A-202
- 1051 N Baker Ave Unit B 203
- 544 N Colorado Ave
- 1494 Eastmont Ave Unit 56
- 1494 Eastmont Ave Unit 33
- 1494 Eastmont Ave Unit 58
- 1055 N Jackson Ave
- 1218 N Ashland Ave
- 946 Briarwood Dr
- 1653 Holly Ln
- 902 N Kenroy Terrace
- 772 N Keller Ave
- 809 N Kenroy Terrace
- 475 N Kansas Ave